
House Prices in Bridgeton
House prices in Bridgeton have an overall average of £138,666 over the last year.
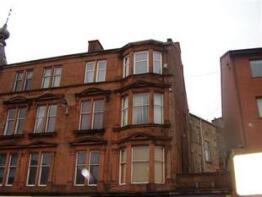
The majority of properties sold in Bridgeton during the last year were flats, selling for an average price of £128,304. Terraced properties sold for an average of £175,475, with semi-detached properties fetching £290,000.
Overall, the historical sold prices in Bridgeton over the last year were 4% up on the previous year and 4% up on the 2022 peak of £133,068.
Properties Sold
3f, Laird Place, Glasgow G40 1JS
| Today | See what it's worth now |
| 26 Jun 2025 | £89,000 |
| 23 Dec 2019 | £70,000 |
61 Weavers Court, Monteith Row, Glasgow G40 1AU
| Today | See what it's worth now |
| 26 Jun 2025 | £138,000 |
| 8 Sep 2005 | £83,005 |
No other historical records.
42, Dalmarnock Drive, Glasgow G40 4LN
| Today | See what it's worth now |
| 25 Jun 2025 | £124,000 |
No other historical records.
Flat 1/2, 3, Mill Street, Glasgow G40 1LT


| Today | See what it's worth now |
| 18 Jun 2025 | £91,000 |
| 6 Feb 2007 | £75,000 |
Flat 2/1, 98a, Main Street, Bridgeton, Glasgow G40 1AL
| Today | See what it's worth now |
| 17 Jun 2025 | £121,750 |
| 29 Nov 2021 | £116,000 |
Flat 2/1, 7, Main Street, Bridgeton, Glasgow G40 1QA
| Today | See what it's worth now |
| 11 Jun 2025 | £86,177 |
| 12 Jul 2023 | £68,500 |
Flat 2/1, 173, Greenhead Street, Glasgow G40 1HX
| Today | See what it's worth now |
| 10 Jun 2025 | £120,000 |
No other historical records.
Flat F, 146, Main Street, Bridgeton, Glasgow G40 1LR
| Today | See what it's worth now |
| 9 Jun 2025 | £102,299 |
No other historical records.
Flat 4/2, 1, Templeton Court, Glasgow G40 1EF

| Today | See what it's worth now |
| 9 Jun 2025 | £283,000 |
| 4 Feb 2015 | £178,000 |
Flat 2/1, 90, Silvergrove Street, Glasgow G40 1DR
| Today | See what it's worth now |
| 5 Jun 2025 | £155,000 |
| 13 Jan 2020 | £119,000 |
Flat 3/2, 539, London Road, Glasgow G40 1NQ
| Today | See what it's worth now |
| 2 Jun 2025 | £151,795 |
No other historical records.
Flat 1/1, 2, Arcadia Place, Glasgow G40 1DS
| Today | See what it's worth now |
| 29 May 2025 | £181,100 |
| 20 Apr 2022 | £151,500 |
Flat 0/2, 144, Tobago Street, Glasgow G40 2RR
| Today | See what it's worth now |
| 26 May 2025 | �£39,600 |
| 5 Aug 2024 | £39,500 |
8, Anson Street, Glasgow G40 1ER
| Today | See what it's worth now |
| 22 May 2025 | £150,000 |
| 3 May 2021 | £116,000 |
Flat 2/1, 8, Tullis Gardens, Glasgow G40 1AF

| Today | See what it's worth now |
| 21 May 2025 | £126,695 |
No other historical records.
Flat 5/1, 15, Templeton Court, Glasgow G40 1EF

| Today | See what it's worth now |
| 20 May 2025 | £300,000 |
| 24 May 2019 | £287,500 |
Flat 1/1, 64, Landressy Place, Glasgow G40 1HF
| Today | See what it's worth now |
| 16 May 2025 | £85,125 |
| 5 Dec 2023 | £89,250 |
Flat B, 116, Main Street, Bridgeton, Glasgow G40 1LX
| Today | See what it's worth now |
| 14 May 2025 | £82,000 |
| 11 Feb 2008 | £65,000 |
No other historical records.
Flat 2/2, 7, Main Street, Bridgeton, Glasgow G40 1QA

| Today | See what it's worth now |
| 13 May 2025 | £75,000 |
No other historical records.
Flat 0/1, 211, Stevenson Street, Glasgow G40 2RW

| Today | See what it's worth now |
| 12 May 2025 | £57,000 |
| 23 Jul 2009 | £45,000 |
Flat 1/1, 33, Dalmarnock Drive, Glasgow G40 4LQ

| Today | See what it's worth now |
| 8 May 2025 | £100,000 |
| 20 Jun 2024 | £100,000 |
108, Silvergrove Street, Glasgow G40 1DR
| Today | See what it's worth now |
| 8 May 2025 | £211,101 |
| 5 Feb 2021 | £148,000 |
Flat 3/6, 82, Templeton Street, Glasgow G40 1EE
| Today | See what it's worth now |
| 6 May 2025 | £234,000 |
| 26 Oct 2015 | £185,000 |
No other historical records.
Flat 2/2, 11, Tullis Gardens, Glasgow G40 1AJ

| Today | See what it's worth now |
| 25 Apr 2025 | £137,000 |
| 5 Feb 2021 | £107,500 |
42, Tullis Gardens, Glasgow G40 1AH
| Today | See what it's worth now |
| 25 Apr 2025 | £134,000 |
| 31 Aug 2020 | £112,000 |
Get ready with a Mortgage in Principle
- Personalised result in just 20 minutes
- Find out how much you can borrow
- Get viewings faster with agents
- No impact on your credit score
What's your property worth?
Source Acknowledgement: © Crown copyright. Scottish house price data is publicly available information produced by the Registers of Scotland. Material has been reproduced with the permission of the Keeper of the Registers of Scotland and contains data compiled by Registers of Scotland. For further information, please contact data@ros.gov.uk. Please note the dates shown here relate to the property's registered date not sold date.This material was last updated on 7 August 2025. It covers the period from 28 July 1995 to 30 June 2025 and contains property transactions which have been registered during that period.
Disclaimer: Rightmove.co.uk provides this Registers of Scotland data "as is". The burden for fitness of the data relies completely with the user and is provided for informational purposes only. No warranty, express or implied, is given relating to the accuracy of content of the Registers of Scotland data and Rightmove plc does not accept any liability for error or omission. If you have found an error with the data or need further information please contact data@ros.gov.uk
Permitted Use: The Registers of Scotland allows the reproduction of the data which it provides to Rightmove.co.uk free of charge in any format or medium only for research, private study or for internal circulation within an organisation. This is subject to it being reproduced accurately and not used in a misleading context. The material must be acknowledged as Crown Copyright. You are not allowed to use this information for commercial purposes, nor must you copy, distribute, sell or publish the data in any way. For any other use of this material, please apply to the Registers of Scotland for a licence. You can do this online at www.ros.gov.uk, by email at data@ros.gov.uk or by writing to Business Development, Registers of Scotland, Meadowbank House, 153 London Road, Edinburgh EH8 7AU.
Map data ©OpenStreetMap contributors.
Rightmove takes no liability for your use of, or reliance on, Rightmove's Instant Valuation due to the limitations of our tracking tool listed here. Use of this tool is taken entirely at your own risk. All rights reserved.