
House Prices in CT11
House prices in CT11 have an overall average of £272,639 over the last year.
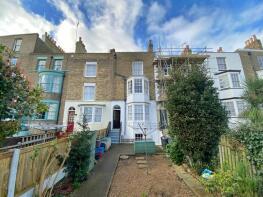
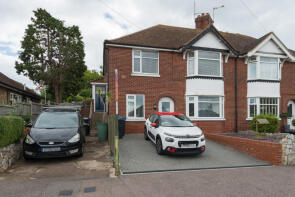
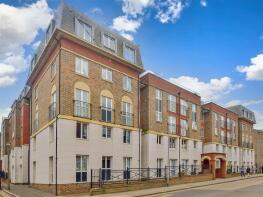
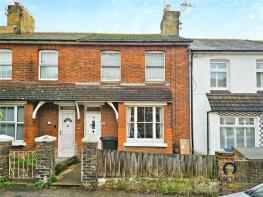
The majority of properties sold in CT11 during the last year were terraced properties, selling for an average price of £271,275. Semi-detached properties sold for an average of £310,039, with flats fetching £176,387.
Overall, the historical sold prices in CT11 over the last year were 6% down on the previous year and 12% down on the 2022 peak of £311,048.
Properties Sold
3, Briganda Walk, St Lukes Avenue, Ramsgate CT11 7LG
| Today | See what it's worth now |
| 24 Jun 2025 | £262,000 |
| 4 Dec 2015 | £173,000 |
6, St Lawrence Chase, Ramsgate CT11 0RD
| Today | See what it's worth now |
| 20 Jun 2025 | £245,000 |
| 15 Jun 2017 | £206,000 |
83, St Lukes Avenue, Ramsgate CT11 7JX
| Today | See what it's worth now |
| 20 Jun 2025 | £345,000 |
| 21 Feb 2020 | £256,000 |
63, Ashburnham Road, Ramsgate CT11 0BH
| Today | See what it's worth now |
| 19 Jun 2025 | £355,000 |
| 9 Jun 2017 | £200,000 |
9, Borrowdale Avenue, Ramsgate CT11 0PS
| Today | See what it's worth now |
| 18 Jun 2025 | £270,000 |
| 23 Jun 2017 | £252,500 |
No other historical records.
42, Bloomsbury Road, Ramsgate CT11 0AQ
| Today | See what it's worth now |
| 12 Jun 2025 | £255,000 |
| 3 Jul 2020 | £165,000 |
No other historical records.
23, Nethercourt Gardens, Ramsgate CT11 0RY
| Today | See what it's worth now |
| 9 Jun 2025 | £330,000 |
No other historical records.
1, Homefleet House, Wellington Crescent, Ramsgate CT11 8JY
| Today | See what it's worth now |
| 9 Jun 2025 | £90,000 |
| 30 Jul 2010 | £80,000 |
1, Salisbury Avenue, Ramsgate CT11 7LH
| Today | See what it's worth now |
| 6 Jun 2025 | £250,000 |
No other historical records.
19, Kentmere Avenue, Ramsgate CT11 0QF
| Today | See what it's worth now |
| 6 Jun 2025 | £288,000 |
| 4 Aug 2006 | £172,000 |
No other historical records.
4, Pegwell Close, Ramsgate CT11 0NB
| Today | See what it's worth now |
| 5 Jun 2025 | £288,000 |
No other historical records.
29, Adelaide Gardens, Ramsgate CT11 9HH
| Today | See what it's worth now |
| 5 Jun 2025 | £350,000 |
No other historical records.
20, Goodwin Road, Ramsgate CT11 0LP
| Today | See what it's worth now |
| 3 Jun 2025 | £182,500 |
| 8 Aug 1996 | £38,325 |
No other historical records.
110, Southwood Road, Ramsgate CT11 0AW

| Today | See what it's worth now |
| 30 May 2025 | £275,000 |
| 19 Jan 2017 | £192,500 |
18, Albert Road, Ramsgate CT11 8DW

| Today | See what it's worth now |
| 30 May 2025 | £435,000 |
| 30 Oct 2015 | £255,000 |
14, Vyeson Court, Queen Street, Ramsgate CT11 9DT
| Today | See what it's worth now |
| 30 May 2025 | £114,000 |
| 29 Sep 2006 | £131,950 |
No other historical records.
15, Dane Road, Ramsgate CT11 7LW
| Today | See what it's worth now |
| 30 May 2025 | £193,000 |
| 15 Jan 2009 | £105,000 |
No other historical records.
86, Station Approach Road, Ramsgate CT11 7RJ
| Today | See what it's worth now |
| 29 May 2025 | £360,000 |
| 22 Aug 2003 | £126,500 |
No other historical records.
6, Waterloo Place, Ramsgate CT11 8JF

| Today | See what it's worth now |
| 23 May 2025 | £170,795 |
| 25 Mar 2008 | £114,500 |
50, Homefleet House, Wellington Crescent, Ramsgate CT11 8JZ

| Today | See what it's worth now |
| 23 May 2025 | £75,000 |
| 1 Jun 2022 | £55,000 |
10, St Lukes Road, Ramsgate CT11 7LD
| Today | See what it's worth now |
| 23 May 2025 | £255,000 |
No other historical records.
7, Belgrave Close, Ramsgate CT11 9TW
| Today | See what it's worth now |
| 23 May 2025 | £185,000 |
| 18 Oct 2017 | £145,000 |
1, King Edward Road, Ramsgate CT11 0AT
| Today | See what it's worth now |
| 22 May 2025 | £245,000 |
| 15 Dec 2017 | £205,000 |
23, Anns Road, Ramsgate CT11 7NL
| Today | See what it's worth now |
| 21 May 2025 | £237,500 |
| 25 Jul 2006 | £74,999 |
No other historical records.
12, Poldark Court, Victoria Parade, Ramsgate CT11 8DA
| Today | See what it's worth now |
| 20 May 2025 | £100,000 |
| 13 Oct 2006 | £105,000 |
Find out how much your property is worth
The following agents can provide you with a free, no-obligation valuation. Simply select the ones you'd like to hear from.
Sponsored
All featured agents have paid a fee to promote their valuation expertise.

TMS Estate Agents
Kent

haart
covering Thanet

Terence Painter Estate Agents
Broadstairs

Mann
Ramsgate

Fresh Estates
Kent

Miles & Barr
Ramsgate
Get ready with a Mortgage in Principle
- Personalised result in just 20 minutes
- Find out how much you can borrow
- Get viewings faster with agents
- No impact on your credit score
Source Acknowledgement: © Crown copyright. England and Wales house price data is publicly available information produced by the HM Land Registry.This material was last updated on 6 August 2025. It covers the period from 1 January 1995 to 30 June 2025 and contains property transactions which have been registered during that period. Contains HM Land Registry data © Crown copyright and database right 2025. This data is licensed under the Open Government Licence v3.0.
Disclaimer: Rightmove.co.uk provides this HM Land Registry data "as is". The burden for fitness of the data relies completely with the user and is provided for informational purposes only. No warranty, express or implied, is given relating to the accuracy of content of the HM Land Registry data and Rightmove does not accept any liability for error or omission. If you have found an error with the data or need further information please contact HM Land Registry.
Permitted Use: Viewers of this Information are granted permission to access this Crown copyright material and to download it onto electronic, magnetic, optical or similar storage media provided that such activities are for private research, study or in-house use only. Any other use of the material requires the formal written permission of Land Registry which can be requested from us, and is subject to an additional licence and associated charge.
Data on planning applications, home extensions and build costs is provided by Resi.co.uk. Planning data is calculated using the last 2 years of residential applications within the selected planning authority. Home extension data, such as build costs and project timelines, are calculated using approximately 9,000 architectural projects Resi has completed, and 23,500 builders quotes submitted via Resi's platform. Build costs are adjusted according to inflation rates to more accurately represent today's prices.
Map data ©OpenStreetMap contributors.
Rightmove takes no liability for your use of, or reliance on, Rightmove's Instant Valuation due to the limitations of our tracking tool listed here. Use of this tool is taken entirely at your own risk. All rights reserved.