
House Prices in CW2
House prices in CW2 have an overall average of £236,720 over the last year.
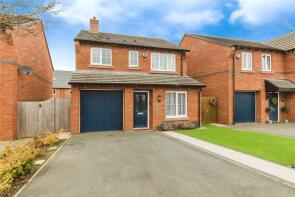
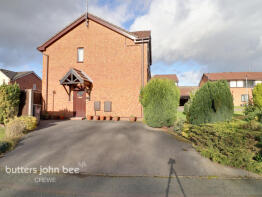
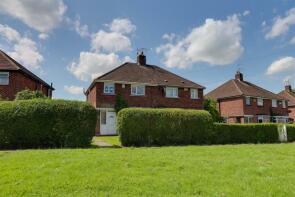
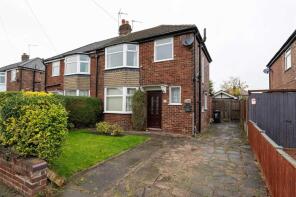
The majority of properties sold in CW2 during the last year were semi-detached properties, selling for an average price of £201,443. Detached properties sold for an average of £360,864, with terraced properties fetching £145,176.
Overall, the historical sold prices in CW2 over the last year were 2% up on the previous year and 8% down on the 2022 peak of £255,963.
Properties Sold
107, Bedford Street, Crewe CW2 6JB
| Today | See what it's worth now |
| 24 Jun 2025 | £135,000 |
| 2 Oct 2002 | £56,950 |
56, Adlington Road, Crewe CW2 8PD
| Today | See what it's worth now |
| 24 Jun 2025 | £169,000 |
| 22 Sep 2008 | £105,000 |
No other historical records.
24, Wood Street, Crewe CW2 6HH
| Today | See what it's worth now |
| 20 Jun 2025 | £122,000 |
| 17 Aug 2017 | £65,000 |
No other historical records.
4, John Jobson Road, Crewe CW2 5JD
| Today | See what it's worth now |
| 19 Jun 2025 | £290,000 |
| 4 Jun 2019 | £245,995 |
No other historical records.
85, Field Lane, Crewe CW2 8ST
| Today | See what it's worth now |
| 17 Jun 2025 | £165,000 |
| 29 Jun 1995 | £51,450 |
No other historical records.
9, Hargrave Avenue, Crewe CW2 8NW
| Today | See what it's worth now |
| 13 Jun 2025 | £169,000 |
| 9 Jun 1995 | £28,500 |
No other historical records.
33, Thirlmere Road, Crewe CW2 8AQ
| Today | See what it's worth now |
| 12 Jun 2025 | £160,000 |
| 29 Apr 2022 | £160,000 |
No other historical records.
41, Capesthorne Road, Crewe CW2 8PA
| Today | See what it's worth now |
| 11 Jun 2025 | £165,000 |
| 14 Oct 2016 | £104,000 |
No other historical records.
2, Gainsborough Court, Stewart Street, Crewe CW2 8BG
| Today | See what it's worth now |
| 10 Jun 2025 | £72,500 |
| 14 Feb 2008 | £89,500 |
No other historical records.
213, Bedford Street, Crewe CW2 6JL
| Today | See what it's worth now |
| 9 Jun 2025 | £180,000 |
| 18 Oct 2002 | £74,500 |
310, Nantwich Road, Crewe CW2 6NY
| Today | See what it's worth now |
| 6 Jun 2025 | £305,000 |
| 7 Mar 2014 | £147,250 |
7, Princess Grove, Crewe CW2 8HR
| Today | See what it's worth now |
| 3 Jun 2025 | £415,000 |
| 18 May 2012 | £190,000 |
No other historical records.
59, Field Lane, Crewe CW2 8ST
| Today | See what it's worth now |
| 30 May 2025 | £218,000 |
| 31 Jan 2020 | £164,000 |
68, Rope Lane, Crewe CW2 6RD
| Today | See what it's worth now |
| 30 May 2025 | £397,500 |
| 30 Oct 2018 | £190,000 |
No other historical records.
19, Moreton Road, Crewe CW2 8QU
| Today | See what it's worth now |
| 30 May 2025 | £160,000 |
| 24 Jan 2003 | £61,500 |
33, Springbank Road, Crewe CW2 5UN
| Today | See what it's worth now |
| 29 May 2025 | £285,000 |
| 20 Dec 2019 | £236,995 |
No other historical records.
2, Capenhurst Avenue, Crewe CW2 8NN
| Today | See what it's worth now |
| 29 May 2025 | £175,000 |
| 19 Dec 2022 | £168,000 |
21, Oakhurst Drive, Crewe CW2 6UE
| Today | See what it's worth now |
| 28 May 2025 | £390,000 |
| 16 Nov 1998 | £76,950 |
No other historical records.
2, Sherwin Street, Crewe CW2 6DJ
| Today | See what it's worth now |
| 27 May 2025 | £177,500 |
| 17 Apr 2015 | £95,000 |
No other historical records.
44, Ruskin Road, Crewe CW2 7JR
| Today | See what it's worth now |
| 27 May 2025 | £125,000 |
| 26 Jul 2024 | £82,000 |
9, Foxglove Close, Crewe CW2 6UD
| Today | See what it's worth now |
| 23 May 2025 | £335,000 |
| 30 Jan 2019 | £257,000 |
No other historical records.
48, Alfred Potts Way, Crewe CW2 5EF
| Today | See what it's worth now |
| 23 May 2025 | £270,000 |
| 27 Jan 2022 | £252,995 |
No other historical records.
1, Henshall Close, Crewe CW2 5XE
| Today | See what it's worth now |
| 23 May 2025 | £325,000 |
| 28 Aug 2020 | £274,995 |
No other historical records.
192a, Nantwich Road, Crewe CW2 6BP
| Today | See what it's worth now |
| 23 May 2025 | £143,000 |
No other historical records.
18, Sandhurst Avenue, Crewe CW2 8FB
| Today | See what it's worth now |
| 23 May 2025 | £195,000 |
| 18 May 2017 | £148,500 |
Find out how much your property is worth
The following agents can provide you with a free, no-obligation valuation. Simply select the ones you'd like to hear from.
Sponsored
All featured agents have paid a fee to promote their valuation expertise.

Wheatcroft & Lloyd
Sandbach

James Du Pavey
Nantwich

Bridgfords
Crewe

Butters John Bee
Crewe

Leaders Sales
Crewe

Whitegates
Crewe
Get ready with a Mortgage in Principle
- Personalised result in just 20 minutes
- Find out how much you can borrow
- Get viewings faster with agents
- No impact on your credit score
What's your property worth?
Source Acknowledgement: © Crown copyright. England and Wales house price data is publicly available information produced by the HM Land Registry.This material was last updated on 6 August 2025. It covers the period from 1 January 1995 to 30 June 2025 and contains property transactions which have been registered during that period. Contains HM Land Registry data © Crown copyright and database right 2025. This data is licensed under the Open Government Licence v3.0.
Disclaimer: Rightmove.co.uk provides this HM Land Registry data "as is". The burden for fitness of the data relies completely with the user and is provided for informational purposes only. No warranty, express or implied, is given relating to the accuracy of content of the HM Land Registry data and Rightmove does not accept any liability for error or omission. If you have found an error with the data or need further information please contact HM Land Registry.
Permitted Use: Viewers of this Information are granted permission to access this Crown copyright material and to download it onto electronic, magnetic, optical or similar storage media provided that such activities are for private research, study or in-house use only. Any other use of the material requires the formal written permission of Land Registry which can be requested from us, and is subject to an additional licence and associated charge.
Data on planning applications, home extensions and build costs is provided by Resi.co.uk. Planning data is calculated using the last 2 years of residential applications within the selected planning authority. Home extension data, such as build costs and project timelines, are calculated using approximately 9,000 architectural projects Resi has completed, and 23,500 builders quotes submitted via Resi's platform. Build costs are adjusted according to inflation rates to more accurately represent today's prices.
Map data ©OpenStreetMap contributors.
Rightmove takes no liability for your use of, or reliance on, Rightmove's Instant Valuation due to the limitations of our tracking tool listed here. Use of this tool is taken entirely at your own risk. All rights reserved.