
House Prices in EX11
House prices in EX11 have an overall average of £455,268 over the last year.
The majority of properties sold in EX11 during the last year were detached properties, selling for an average price of £630,914. Terraced properties sold for an average of £249,552, with semi-detached properties fetching £318,737.
Overall, the historical sold prices in EX11 over the last year were 1% up on the previous year and 8% down on the 2022 peak of £493,081.
Properties Sold
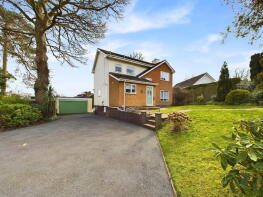
12, Moorlands, Ottery St. Mary EX11 1UL
| Today | See what it's worth now |
| 27 Jun 2025 | £592,000 |
| 23 Sep 2020 | £542,500 |
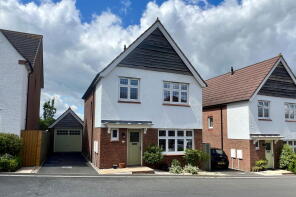
107, Butts Road, Ottery St. Mary EX11 1FP
| Today | See what it's worth now |
| 23 Jun 2025 | £399,950 |
| 30 Jun 2017 | £302,995 |
No other historical records.
1, Gerway Close, Ottery St. Mary EX11 1GL

| Today | See what it's worth now |
| 18 Jun 2025 | £685,000 |
| 31 Mar 2017 | £490,000 |
No other historical records.
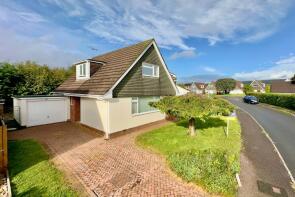
21, Chineway Gardens, Ottery St Mary EX11 1JG
| Today | See what it's worth now |
| 13 Jun 2025 | £315,000 |
No other historical records.
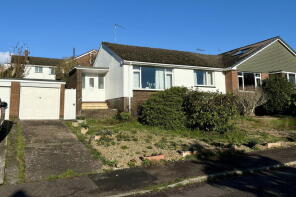
44, Raleigh Road, Ottery St. Mary EX11 1TG
| Today | See what it's worth now |
| 10 Jun 2025 | £245,000 |
| 18 May 2009 | £197,000 |
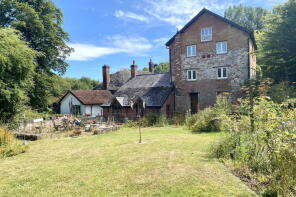
The Old Mill, Road From Talaton Farm Cross To Fairmile Inn, Ottery St. Mary EX11 1LS
| Today | See what it's worth now |
| 6 Jun 2025 | £500,000 |
| 26 Sep 2006 | £460,000 |
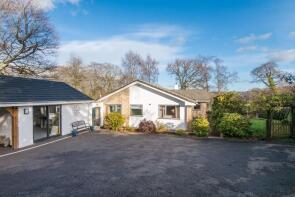
Coppins, Higher Broad Oak Road, Ottery St. Mary EX11 1XJ
| Today | See what it's worth now |
| 29 May 2025 | £800,000 |
| 17 Dec 2021 | £790,000 |
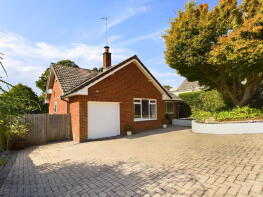
17, Oak Close, Ottery St. Mary EX11 1BB
| Today | See what it's worth now |
| 22 May 2025 | £492,000 |
| 16 May 2008 | £285,000 |
No other historical records.
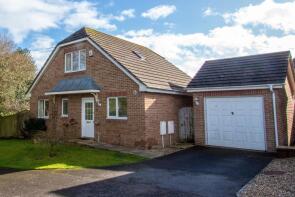
Otter Hatch, Thorne Farm Way, Ottery St. Mary EX11 1GX
| Today | See what it's worth now |
| 16 May 2025 | £350,000 |
| 22 Jun 2001 | £144,950 |
No other historical records.
21, Ridgeway, Ottery St Mary EX11 1DT

| Today | See what it's worth now |
| 9 May 2025 | £275,000 |
No other historical records.
Dene, Lower Broad Oak Road, Ottery St. Mary EX11 1XH
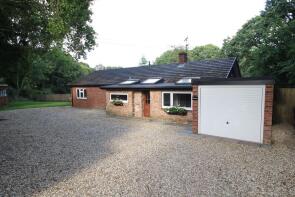
| Today | See what it's worth now |
| 6 May 2025 | £301,442 |
| 26 Jan 2024 | £765,000 |
38, St Budeaux Close, Ottery St. Mary EX11 1HR
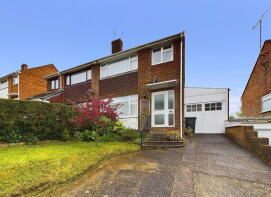
| Today | See what it's worth now |
| 11 Apr 2025 | £285,000 |
| 31 Aug 2011 | £161,000 |
No other historical records.
5, The Crescent, Franklea Close, Ottery St. Mary EX11 1US
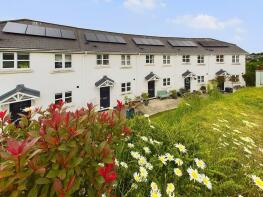
| Today | See what it's worth now |
| 3 Apr 2025 | £370,000 |
| 8 Oct 2018 | £350,000 |
No other historical records.
36, Longdogs Lane, Ottery St. Mary EX11 1HU
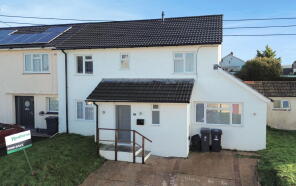
| Today | See what it's worth now |
| 31 Mar 2025 | £347,500 |
| 27 Jan 2023 | £352,500 |
18, Meadow Close, Ottery St. Mary EX11 1EW
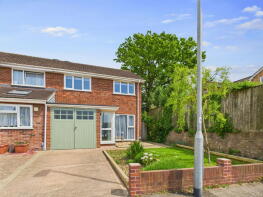
| Today | See what it's worth now |
| 31 Mar 2025 | £300,000 |
| 10 Feb 2023 | £320,000 |
87, Claremont Field, Ottery St. Mary EX11 1RP
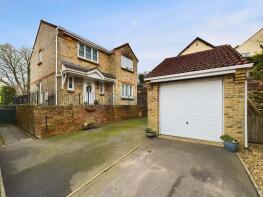
| Today | See what it's worth now |
| 31 Mar 2025 | £495,000 |
| 16 Apr 2004 | £227,500 |
No other historical records.
24, Raleigh Road, Ottery St. Mary EX11 1TG
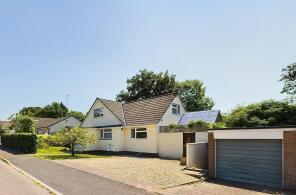
| Today | See what it's worth now |
| 31 Mar 2025 | £455,000 |
| 7 Jan 2016 | £325,000 |
15, Washbrook View, Ottery St. Mary EX11 1EP

| Today | See what it's worth now |
| 31 Mar 2025 | £320,000 |
| 13 Oct 2009 | £185,000 |
No other historical records.
Amen Court West, Paternoster Row, Ottery St Mary EX11 1DP
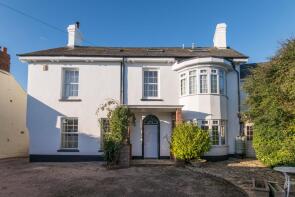
| Today | See what it's worth now |
| 28 Mar 2025 | £610,000 |
| 28 Feb 2000 | £190,000 |
No other historical records.
73, Butts Road, Ottery St. Mary EX11 1FP
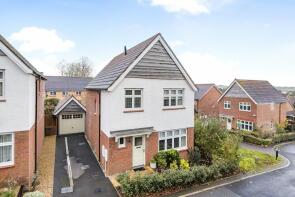
| Today | See what it's worth now |
| 28 Mar 2025 | £415,000 |
| 23 Sep 2016 | £296,995 |
No other historical records.
Woodbines, Ford Lane, Ottery St. Mary EX11 1XE
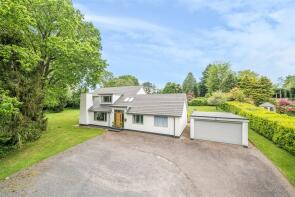
| Today | See what it's worth now |
| 28 Mar 2025 | £975,000 |
| 24 Nov 2020 | £540,000 |
No other historical records.
4, Ridgeway, Ottery St. Mary EX11 1DT
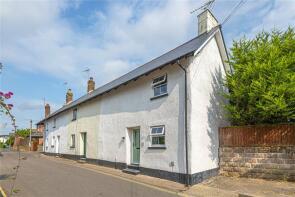
| Today | See what it's worth now |
| 27 Mar 2025 | £217,500 |
| 28 Feb 2023 | £245,000 |
27, Mill Street, Ottery St. Mary EX11 1AB

| Today | See what it's worth now |
| 21 Mar 2025 | £190,000 |
| 29 Apr 2019 | £142,500 |
15, Perrys Gardens, Ottery St. Mary EX11 1XA

| Today | See what it's worth now |
| 21 Mar 2025 | £320,000 |
| 20 Dec 2001 | £129,000 |
3 Tiptree Cottage, Sandhill Street, Ottery St. Mary EX11 1EF
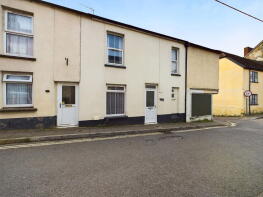
| Today | See what it's worth now |
| 21 Mar 2025 | £177,000 |
| 7 Dec 1998 | £49,000 |
No other historical records.
Find out how much your property is worth
The following agents can provide you with a free, no-obligation valuation. Simply select the ones you'd like to hear from.
Sponsored
All featured agents have paid a fee to promote their valuation expertise.

Redferns
Ottery St Mary

Hall & Scott
Ottery St. Mary
Get ready with a Mortgage in Principle
- Personalised result in just 20 minutes
- Find out how much you can borrow
- Get viewings faster with agents
- No impact on your credit score
Source Acknowledgement: © Crown copyright. England and Wales house price data is publicly available information produced by the HM Land Registry.This material was last updated on 6 August 2025. It covers the period from 1 January 1995 to 30 June 2025 and contains property transactions which have been registered during that period. Contains HM Land Registry data © Crown copyright and database right 2025. This data is licensed under the Open Government Licence v3.0.
Disclaimer: Rightmove.co.uk provides this HM Land Registry data "as is". The burden for fitness of the data relies completely with the user and is provided for informational purposes only. No warranty, express or implied, is given relating to the accuracy of content of the HM Land Registry data and Rightmove does not accept any liability for error or omission. If you have found an error with the data or need further information please contact HM Land Registry.
Permitted Use: Viewers of this Information are granted permission to access this Crown copyright material and to download it onto electronic, magnetic, optical or similar storage media provided that such activities are for private research, study or in-house use only. Any other use of the material requires the formal written permission of Land Registry which can be requested from us, and is subject to an additional licence and associated charge.
Data on planning applications, home extensions and build costs is provided by Resi.co.uk. Planning data is calculated using the last 2 years of residential applications within the selected planning authority. Home extension data, such as build costs and project timelines, are calculated using approximately 9,000 architectural projects Resi has completed, and 23,500 builders quotes submitted via Resi's platform. Build costs are adjusted according to inflation rates to more accurately represent today's prices.
Map data ©OpenStreetMap contributors.
Rightmove takes no liability for your use of, or reliance on, Rightmove's Instant Valuation due to the limitations of our tracking tool listed here. Use of this tool is taken entirely at your own risk. All rights reserved.

