
House Prices in Fleet
House prices in Fleet have an overall average of £491,047 over the last year.
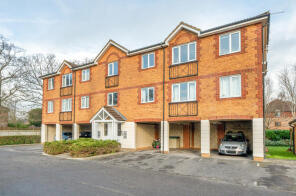
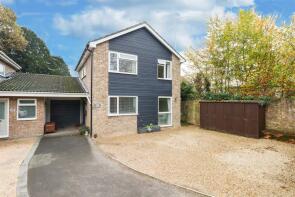
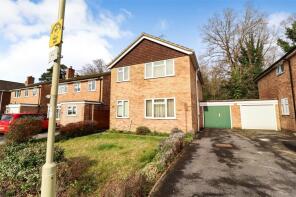
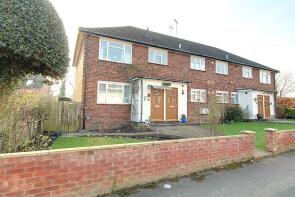
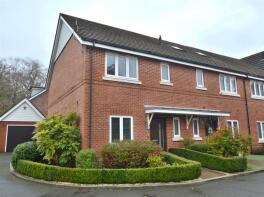
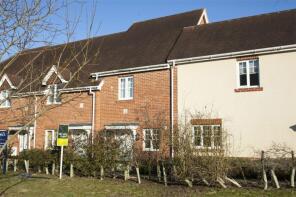
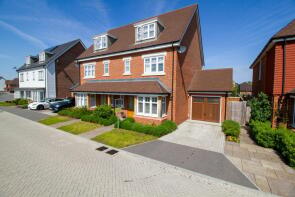
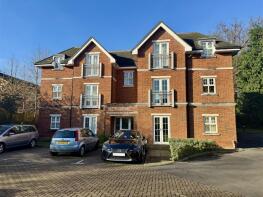
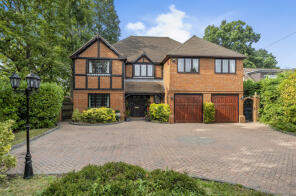
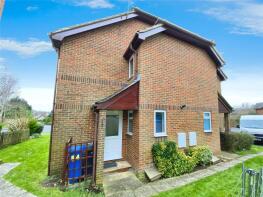
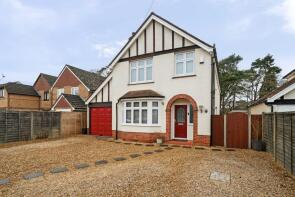
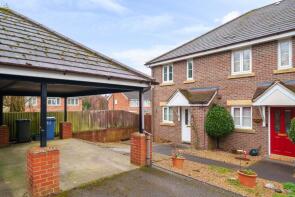
The majority of properties sold in Fleet during the last year were detached properties, selling for an average price of £716,176. Semi-detached properties sold for an average of £478,931, with flats fetching £233,553.
Overall, the historical sold prices in Fleet over the last year were similar to the previous year and similar to the 2022 peak of £492,259.
Properties Sold
5, Ellen Drive, Fleet GU51 2XH
| Today | See what it's worth now |
| 27 Jun 2025 | £220,000 |
| 10 Oct 2012 | £168,000 |
51, Durnsford Avenue, Fleet GU52 7TA
| Today | See what it's worth now |
| 25 Jun 2025 | £590,000 |
| 21 Jun 2013 | £320,000 |
25, George Road, Fleet GU51 3PS
| Today | See what it's worth now |
| 13 Jun 2025 | £495,000 |
No other historical records.
7, Meadow Court, Victoria Road, Fleet GU51 4DH
| Today | See what it's worth now |
| 13 Jun 2025 | £243,000 |
| 3 Oct 2003 | £155,000 |
1, Reynolds Street, Fleet GU51 1LG
| Today | See what it's worth now |
| 12 Jun 2025 | £450,000 |
| 17 Oct 2022 | £440,000 |
12, Water Rede, Crookham Village, Fleet GU52 0YH
| Today | See what it's worth now |
| 11 Jun 2025 | £412,000 |
| 3 Feb 2012 | £249,950 |
64, Clarence Road, Fleet GU51 3RY
| Today | See what it's worth now |
| 6 Jun 2025 | £395,000 |
| 24 Jun 2014 | £291,606 |
37, Elizabeth Drive, Church Crookham, Fleet GU52 6HW

| Today | See what it's worth now |
| 6 Jun 2025 | £510,000 |
| 25 Jun 2021 | £465,000 |
36, King John Street, Fleet GU51 1HX
| Today | See what it's worth now |
| 6 Jun 2025 | £499,000 |
| 14 Jul 2004 | £256,995 |
No other historical records.
56, Barn Meadow Close, Church Crookham, Fleet GU52 0YB
| Today | See what it's worth now |
| 6 Jun 2025 | £192,500 |
| 28 Oct 2003 | £121,500 |
17, Bramshott Place, Fleet Road, Fleet GU51 4QF
| Today | See what it's worth now |
| 30 May 2025 | £210,000 |
| 31 Aug 2006 | £217,950 |
No other historical records.
30, Chesilton Crescent, Church Crookham, Fleet GU52 6PB
| Today | See what it's worth now |
| 30 May 2025 | £525,000 |
No other historical records.
18, Redwoods Way, Church Crookham, Fleet GU52 8UL
| Today | See what it's worth now |
| 30 May 2025 | £215,000 |
| 26 Jan 2001 | £85,000 |
88, Tamworth Drive, Fleet GU51 2UP

| Today | See what it's worth now |
| 29 May 2025 | £260,000 |
| 8 Jun 2022 | £248,000 |
27, Teaseltun, Fleet GU51 5BY
| Today | See what it's worth now |
| 28 May 2025 | £492,000 |
| 29 Jul 2016 | £410,000 |
No other historical records.
34, St Swithins Road, Fleet GU51 1GL
| Today | See what it's worth now |
| 28 May 2025 | £340,000 |
| 27 Nov 2015 | £270,000 |
2, Waterlilies, Fleet GU51 5ED
| Today | See what it's worth now |
| 27 May 2025 | £665,000 |
| 28 May 2020 | £585,000 |
No other historical records.
31, Bramshott Place, Fleet Road, Fleet GU51 4QF
| Today | See what it's worth now |
| 23 May 2025 | £240,000 |
| 19 Dec 2006 | £217,500 |
No other historical records.
111, Aldershot Road, Church Crookham, Fleet GU52 8JY
| Today | See what it's worth now |
| 23 May 2025 | £985,000 |
| 24 Jun 1999 | £147,500 |
No other historical records.
54, Barn Meadow Close, Church Crookham, Fleet GU52 0YB
| Today | See what it's worth now |
| 23 May 2025 | £197,000 |
| 8 Feb 2001 | £83,000 |
63, Westover Road, Fleet GU51 3DE
| Today | See what it's worth now |
| 21 May 2025 | £810,000 |
No other historical records.
10, Hall Drive, Fleet GU52 6LD
| Today | See what it's worth now |
| 19 May 2025 | £382,500 |
| 15 Jul 2019 | £320,000 |
12, Oakhanger House, Kingsley Square, Fleet GU51 1AJ
| Today | See what it's worth now |
| 19 May 2025 | £285,000 |
| 7 May 2020 | £220,000 |
1, Awbridge House, Lyndhurst Road, Fleet GU51 1EY


| Today | See what it's worth now |
| 16 May 2025 | £235,000 |
| 19 Mar 2008 | £144,375 |
45, Nugent Close, Church Crookham, Fleet GU52 8BH
| Today | See what it's worth now |
| 16 May 2025 | £725,000 |
| 21 Dec 2018 | £632,500 |
No other historical records.
Get ready with a Mortgage in Principle
- Personalised result in just 20 minutes
- Find out how much you can borrow
- Get viewings faster with agents
- No impact on your credit score
What's your property worth?
Source Acknowledgement: © Crown copyright. England and Wales house price data is publicly available information produced by the HM Land Registry.This material was last updated on 6 August 2025. It covers the period from 1 January 1995 to 30 June 2025 and contains property transactions which have been registered during that period. Contains HM Land Registry data © Crown copyright and database right 2025. This data is licensed under the Open Government Licence v3.0.
Disclaimer: Rightmove.co.uk provides this HM Land Registry data "as is". The burden for fitness of the data relies completely with the user and is provided for informational purposes only. No warranty, express or implied, is given relating to the accuracy of content of the HM Land Registry data and Rightmove does not accept any liability for error or omission. If you have found an error with the data or need further information please contact HM Land Registry.
Permitted Use: Viewers of this Information are granted permission to access this Crown copyright material and to download it onto electronic, magnetic, optical or similar storage media provided that such activities are for private research, study or in-house use only. Any other use of the material requires the formal written permission of Land Registry which can be requested from us, and is subject to an additional licence and associated charge.
Map data ©OpenStreetMap contributors.
Rightmove takes no liability for your use of, or reliance on, Rightmove's Instant Valuation due to the limitations of our tracking tool listed here. Use of this tool is taken entirely at your own risk. All rights reserved.