
House Prices in Huyton
House prices in Huyton have an overall average of £188,046 over the last year.
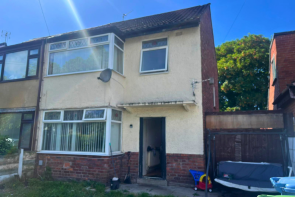
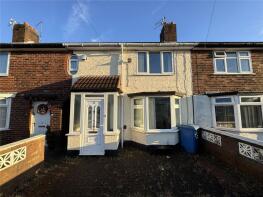
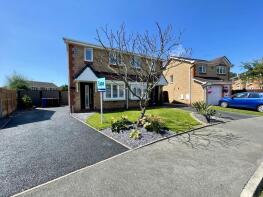
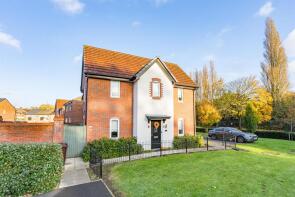
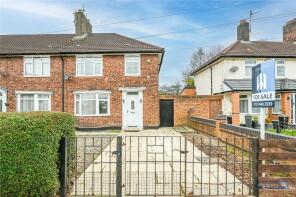
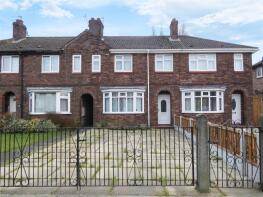
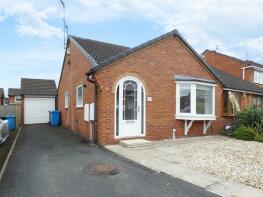
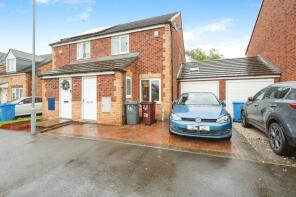
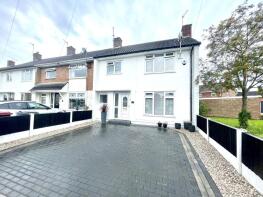
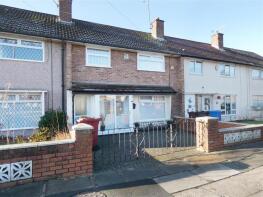
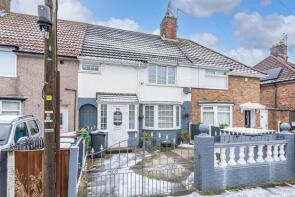
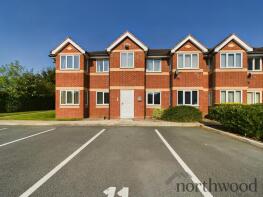
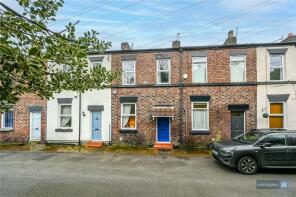
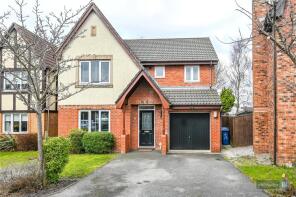
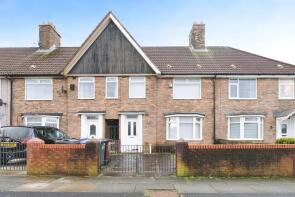
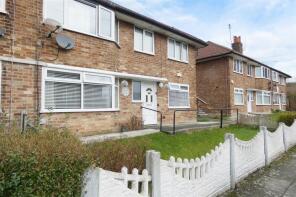
The majority of properties sold in Huyton during the last year were semi-detached properties, selling for an average price of £187,061. Terraced properties sold for an average of £147,872, with detached properties fetching £287,230.
Overall, the historical sold prices in Huyton over the last year were 2% down on the previous year and 3% up on the 2022 peak of £182,785.
Properties Sold
51, Grant Road, Liverpool L14 0LE
| Today | See what it's worth now |
| 20 Jun 2025 | £119,000 |
| 11 Apr 2008 | £88,000 |
21, Shellingford Road, Liverpool L14 0PD
| Today | See what it's worth now |
| 19 Jun 2025 | £125,000 |
| 18 Sep 1998 | £23,000 |
No other historical records.
48, Halebank Avenue, Liverpool L36 4AP


| Today | See what it's worth now |
| 13 Jun 2025 | £78,750 |
No other historical records.
9, St Andrews Drive, Liverpool L36 8JF
| Today | See what it's worth now |
| 13 Jun 2025 | £174,000 |
| 30 Nov 2021 | £120,000 |
1, Redwood Street, Liverpool L36 1AA
| Today | See what it's worth now |
| 9 Jun 2025 | £223,000 |
| 29 Mar 2019 | £164,995 |
No other historical records.
36, Adswood Road, Huyton L36 7XP

| Today | See what it's worth now |
| 6 Jun 2025 | £100,000 |
No other historical records.
36, Twig Lane, Liverpool L36 2LQ
| Today | See what it's worth now |
| 5 Jun 2025 | £165,000 |
| 22 Dec 2015 | £107,000 |
40, Manley Road, Huyton L36 0TL
| Today | See what it's worth now |
| 4 Jun 2025 | £160,000 |
No other historical records.
9, Wokingham Grove, Liverpool L36 5YX
| Today | See what it's worth now |
| 30 May 2025 | £199,950 |
| 10 Feb 2017 | £125,000 |
No other historical records.
20, Fernwood Avenue, Liverpool L36 8AJ
| Today | See what it's worth now |
| 30 May 2025 | £152,500 |
| 29 Mar 2019 | £100,000 |
No other historical records.
17, Barnwood Road, Liverpool L36 2NX

| Today | See what it's worth now |
| 28 May 2025 | £75,000 |
| 4 Feb 2005 | £67,000 |
No other historical records.
6, Essex Road, Liverpool L36 1XW
| Today | See what it's worth now |
| 23 May 2025 | £165,000 |
| 30 Apr 2021 | £139,000 |
19, Dryden Grove, Liverpool L36 0UP
| Today | See what it's worth now |
| 22 May 2025 | £152,500 |
| 25 Apr 2012 | £72,000 |
No other historical records.
47, Barford Road, Liverpool L36 8DE
| Today | See what it's worth now |
| 22 May 2025 | £150,000 |
| 31 Jan 1995 | £34,250 |
No other historical records.
11, Dinas Court, Harrington Road, Liverpool L36 2QY
| Today | See what it's worth now |
| 20 May 2025 | £71,000 |
| 14 Sep 2007 | £100,300 |
No other historical records.
23, Priory Court, Ellison Grove, Liverpool L36 9GE
| Today | See what it's worth now |
| 19 May 2025 | £110,000 |
| 13 Jun 2017 | £80,000 |
93, Seel Road, Huyton L36 6DF
| Today | See what it's worth now |
| 19 May 2025 | £230,000 |
No other historical records.
41, Oxford Road, Liverpool L36 1XF
| Today | See what it's worth now |
| 19 May 2025 | £155,000 |
| 6 Mar 2006 | £97,500 |
5, The Brooklands, Liverpool L36 5YD
| Today | See what it's worth now |
| 19 May 2025 | £242,500 |
| 20 Oct 2014 | £146,000 |
No other historical records.
9, Anderton Terrace, Liverpool L36 4HS
| Today | See what it's worth now |
| 19 May 2025 | £150,000 |
| 18 Aug 2023 | £142,000 |
39, Balmoral Way, Prescot L34 1QD
| Today | See what it's worth now |
| 15 May 2025 | £305,000 |
| 29 Aug 2002 | £121,995 |
No other historical records.
29, Endmoor Road, Liverpool L36 3UH
| Today | See what it's worth now |
| 14 May 2025 | £155,000 |
| 7 Jul 2017 | £51,000 |
No other historical records.
14, St Marks Road, Liverpool L36 0XA
| Today | See what it's worth now |
| 12 May 2025 | £120,000 |
| 3 Jun 2020 | £65,000 |
32, Birch Road, Liverpool L36 0XD
| Today | See what it's worth now |
| 12 May 2025 | £162,000 |
| 15 May 1998 | £42,000 |
No other historical records.
171, Pilch Lane, Liverpool L14 0LD

| Today | See what it's worth now |
| 9 May 2025 | £110,000 |
No other historical records.
Get ready with a Mortgage in Principle
- Personalised result in just 20 minutes
- Find out how much you can borrow
- Get viewings faster with agents
- No impact on your credit score
What's your property worth?
Source Acknowledgement: © Crown copyright. England and Wales house price data is publicly available information produced by the HM Land Registry.This material was last updated on 6 August 2025. It covers the period from 1 January 1995 to 30 June 2025 and contains property transactions which have been registered during that period. Contains HM Land Registry data © Crown copyright and database right 2025. This data is licensed under the Open Government Licence v3.0.
Disclaimer: Rightmove.co.uk provides this HM Land Registry data "as is". The burden for fitness of the data relies completely with the user and is provided for informational purposes only. No warranty, express or implied, is given relating to the accuracy of content of the HM Land Registry data and Rightmove does not accept any liability for error or omission. If you have found an error with the data or need further information please contact HM Land Registry.
Permitted Use: Viewers of this Information are granted permission to access this Crown copyright material and to download it onto electronic, magnetic, optical or similar storage media provided that such activities are for private research, study or in-house use only. Any other use of the material requires the formal written permission of Land Registry which can be requested from us, and is subject to an additional licence and associated charge.
Map data ©OpenStreetMap contributors.
Rightmove takes no liability for your use of, or reliance on, Rightmove's Instant Valuation due to the limitations of our tracking tool listed here. Use of this tool is taken entirely at your own risk. All rights reserved.