
House Prices in Kingsley
House prices in Kingsley have an overall average of £238,478 over the last year.
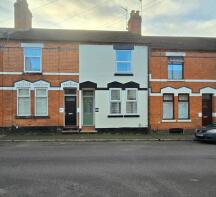
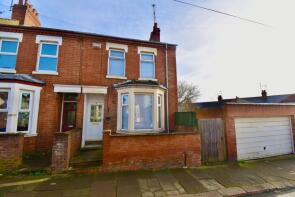
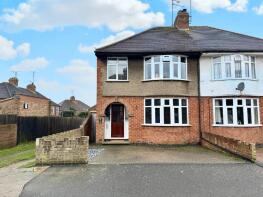
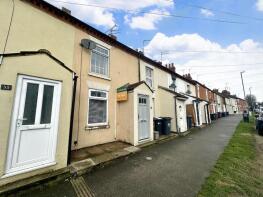
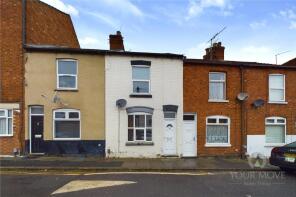
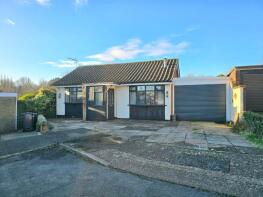
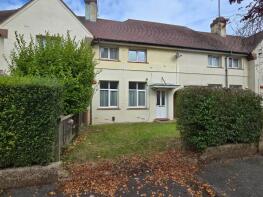
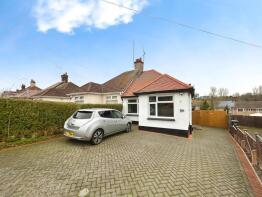
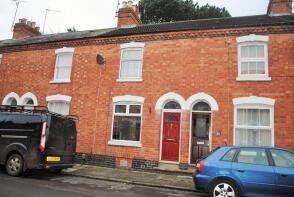
The majority of properties sold in Kingsley during the last year were terraced properties, selling for an average price of £225,987. Semi-detached properties sold for an average of £246,371, with detached properties fetching £352,594.
Overall, the historical sold prices in Kingsley over the last year were 5% up on the previous year and 3% down on the 2022 peak of £245,408.
Properties Sold
79, Milton Street, Northampton NN2 7JG
| Today | See what it's worth now |
| 6 Jun 2025 | £222,000 |
| 15 Dec 2023 | £210,000 |
No other historical records.
2, Newnham Road, Northampton NN2 7RE

| Today | See what it's worth now |
| 30 May 2025 | £280,000 |
| 14 Dec 2018 | £200,000 |
No other historical records.
2, Cecil Road, Northampton NN2 6PQ
| Today | See what it's worth now |
| 30 May 2025 | £211,500 |
| 6 Apr 2001 | £60,000 |
No other historical records.
45, Greenview Drive, Northampton NN2 7LB


| Today | See what it's worth now |
| 27 May 2025 | £195,000 |
| 26 May 2022 | £196,500 |
3, Branksome Avenue, Northampton NN2 6ND
| Today | See what it's worth now |
| 23 May 2025 | £270,000 |
| 27 Aug 2021 | £231,000 |
35, Boughton Green Road, Northampton NN2 7SW
| Today | See what it's worth now |
| 23 May 2025 | £159,995 |
| 9 Dec 2003 | £90,000 |
7, Kenmuir Gardens, Northampton NN2 7EA
| Today | See what it's worth now |
| 22 May 2025 | £212,000 |
| 23 Jan 2015 | £133,000 |
15, Murray Avenue, Northampton NN2 7BS
| Today | See what it's worth now |
| 20 May 2025 | £180,000 |
| 16 Aug 2013 | £130,000 |
47, Edinburgh Road, Northampton NN2 6PH
| Today | See what it's worth now |
| 16 May 2025 | £225,000 |
| 26 Oct 2015 | £148,000 |
No other historical records.
26, Graduate Close, Northampton NN2 7FH
| Today | See what it's worth now |
| 16 May 2025 | £245,000 |
| 24 Feb 2021 | £222,950 |
No other historical records.
72, Junction Road, Northampton NN2 7HS
| Today | See what it's worth now |
| 16 May 2025 | £173,000 |
| 7 Feb 2014 | £125,000 |
7, Brackenhill Close, Northampton NN2 7LD
| Today | See what it's worth now |
| 16 May 2025 | £220,000 |
| 6 Jan 2016 | £160,000 |
No other historical records.
31, Wentworth Way, Northampton NN2 7LW
| Today | See what it's worth now |
| 14 May 2025 | £240,000 |
| 20 Jan 1995 | £48,000 |
No other historical records.
15, Fairway, Northampton NN2 7JX
| Today | See what it's worth now |
| 12 May 2025 | £284,000 |
| 14 Aug 2020 | £230,000 |
9, Green End, Northampton NN2 6RD
| Today | See what it's worth now |
| 12 May 2025 | £240,000 |
| 11 Feb 2008 | £140,000 |
138, Kingsthorpe Grove, Northampton NN2 6PD
| Today | See what it's worth now |
| 9 May 2025 | £305,000 |
| 31 Jul 2014 | £175,000 |
6, Baker Street, Northampton NN2 6DJ

| Today | See what it's worth now |
| 8 May 2025 | £181,000 |
No other historical records.
31, Stanhope Road, Northampton NN2 6JU
| Today | See what it's worth now |
| 6 May 2025 | £212,000 |
| 14 Jan 2021 | £180,000 |
15, Bective Close, Northampton NN2 7FF
| Today | See what it's worth now |
| 2 May 2025 | £100,000 |
No other historical records.
106, Kenmuir Avenue, Northampton NN2 7EJ
| Today | See what it's worth now |
| 2 May 2025 | £193,000 |
| 30 May 2014 | £116,000 |
Flat 5, 94 Park House, Kingsley Park Terrace, Northampton NN2 7HL
| Today | See what it's worth now |
| 30 Apr 2025 | £153,000 |
| 1 Apr 2015 | £138,950 |
No other historical records.
83, Semilong Road, Northampton NN2 6DG
| Today | See what it's worth now |
| 29 Apr 2025 | £222,000 |
| 23 Feb 2001 | £30,000 |
No other historical records.
7, Kingsland Close, Northampton NN2 7QA
| Today | See what it's worth now |
| 25 Apr 2025 | £240,000 |
| 15 Jan 2016 | £100,000 |
No other historical records.
19, Masefield Way, Northampton NN2 7JT
| Today | See what it's worth now |
| 25 Apr 2025 | £214,000 |
| 1 Mar 2019 | £177,000 |
22, Lincoln Street, Northampton NN2 6NR
| Today | See what it's worth now |
| 17 Apr 2025 | £205,000 |
| 16 Feb 2018 | £171,500 |
Get ready with a Mortgage in Principle
- Personalised result in just 20 minutes
- Find out how much you can borrow
- Get viewings faster with agents
- No impact on your credit score
What's your property worth?
Source Acknowledgement: © Crown copyright. England and Wales house price data is publicly available information produced by the HM Land Registry.This material was last updated on 6 August 2025. It covers the period from 1 January 1995 to 30 June 2025 and contains property transactions which have been registered during that period. Contains HM Land Registry data © Crown copyright and database right 2025. This data is licensed under the Open Government Licence v3.0.
Disclaimer: Rightmove.co.uk provides this HM Land Registry data "as is". The burden for fitness of the data relies completely with the user and is provided for informational purposes only. No warranty, express or implied, is given relating to the accuracy of content of the HM Land Registry data and Rightmove does not accept any liability for error or omission. If you have found an error with the data or need further information please contact HM Land Registry.
Permitted Use: Viewers of this Information are granted permission to access this Crown copyright material and to download it onto electronic, magnetic, optical or similar storage media provided that such activities are for private research, study or in-house use only. Any other use of the material requires the formal written permission of Land Registry which can be requested from us, and is subject to an additional licence and associated charge.
Map data ©OpenStreetMap contributors.
Rightmove takes no liability for your use of, or reliance on, Rightmove's Instant Valuation due to the limitations of our tracking tool listed here. Use of this tool is taken entirely at your own risk. All rights reserved.