
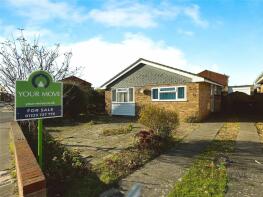
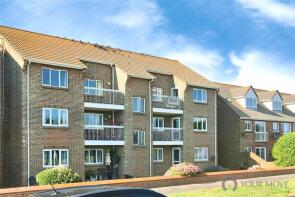
House Prices in Langney Point
House prices in Langney Point have an overall average of £305,342 over the last year.
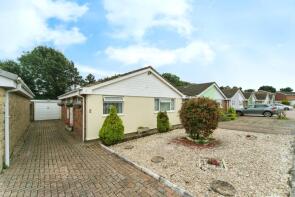
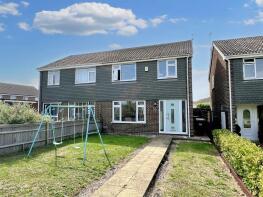
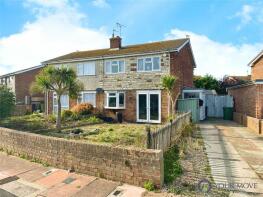
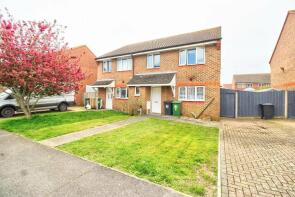
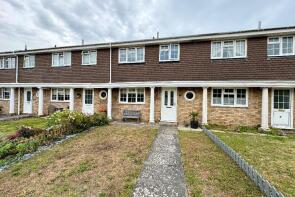
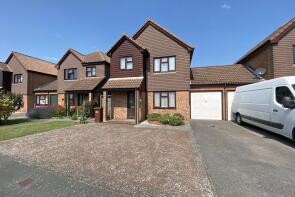
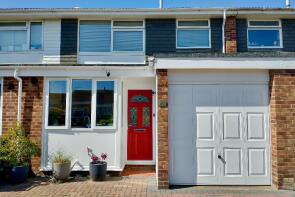
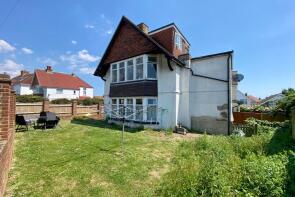
The majority of properties sold in Langney Point during the last year were semi-detached properties, selling for an average price of £331,615. Terraced properties sold for an average of £316,235, with detached properties fetching £356,615.
Overall, the historical sold prices in Langney Point over the last year were 1% up on the previous year and 2% up on the 2022 peak of £300,281.
Properties Sold
55, Beatty Road, Eastbourne BN23 6DA
| Today | See what it's worth now |
| 25 Mar 2025 | £325,000 |
| 4 Oct 2007 | £190,000 |
No other historical records.
7, Sovereign Close, Eastbourne BN23 6FE
| Today | See what it's worth now |
| 7 Mar 2025 | £425,000 |
| 6 Mar 2014 | £250,000 |
No other historical records.
33, Langney Green, Eastbourne BN23 6HY
| Today | See what it's worth now |
| 28 Feb 2025 | £315,000 |
| 23 Apr 2021 | £272,000 |
No other historical records.
16, Wallis Avenue, Eastbourne BN23 6LR
| Today | See what it's worth now |
| 26 Feb 2025 | £295,000 |
| 16 Jan 2017 | £195,000 |
18, Royal Sovereign View, Eastbourne BN23 6EQ
| Today | See what it's worth now |
| 26 Feb 2025 | £230,000 |
| 3 Dec 2021 | £215,000 |
16, St Anthonys Avenue, Eastbourne BN23 6LB

| Today | See what it's worth now |
| 25 Feb 2025 | £350,000 |
| 25 Feb 2025 | £350,000 |
5, Middleton Drive, Eastbourne BN23 6HD
| Today | See what it's worth now |
| 25 Feb 2025 | £380,000 |
| 15 Apr 2010 | £185,000 |
No other historical records.
56, Aylesbury Avenue, Eastbourne BN23 6EJ
| Today | See what it's worth now |
| 17 Feb 2025 | £315,000 |
| 8 Apr 2015 | £205,000 |
7, Drake Avenue, Eastbourne BN23 6BW
| Today | See what it's worth now |
| 10 Feb 2025 | £300,000 |
| 31 Jul 1995 | £52,500 |
No other historical records.
39, Hardy Drive, Eastbourne BN23 6EP
| Today | See what it's worth now |
| 5 Feb 2025 | £325,000 |
| 24 Mar 2000 | £82,950 |
1, Cornwallis Close, Eastbourne BN23 6AU
| Today | See what it's worth now |
| 30 Jan 2025 | £377,500 |
| 18 Feb 2008 | £224,000 |
2, Pound Close, Eastbourne BN23 6EF
| Today | See what it's worth now |
| 16 Jan 2025 | £353,000 |
| 4 May 2012 | £222,500 |
2, Walker Close, Eastbourne BN23 6AQ
| Today | See what it's worth now |
| 15 Jan 2025 | £286,000 |
| 14 Jan 2011 | £185,000 |
4, Hereward Road, Eastbourne BN23 6TG
| Today | See what it's worth now |
| 15 Jan 2025 | £320,000 |
| 5 Apr 2002 | £53,000 |
No other historical records.
9, Winston Crescent, Eastbourne BN23 6NL
| Today | See what it's worth now |
| 13 Jan 2025 | £68,000 |
| 27 Jan 2006 | £80,000 |
3, Sovereign Close, Eastbourne BN23 6FE
| Today | See what it's worth now |
| 10 Jan 2025 | £380,000 |
| 24 Jan 2018 | £310,000 |
9, The Circus, Eastbourne BN23 6LL
| Today | See what it's worth now |
| 17 Dec 2024 | £340,000 |
| 19 Oct 2018 | £248,500 |
No other historical records.
33, Peyton Close, Eastbourne BN23 6AF


| Today | See what it's worth now |
| 17 Dec 2024 | £362,000 |
No other historical records.
64, Royal Sovereign View, Eastbourne BN23 6EQ

| Today | See what it's worth now |
| 12 Dec 2024 | £180,000 |
| 30 Apr 2021 | £170,000 |
3, Delavall Walk, Eastbourne BN23 6ER
| Today | See what it's worth now |
| 11 Dec 2024 | £325,000 |
| 19 Mar 2018 | £245,000 |
7, Schofield Way, Eastbourne BN23 6HQ
| Today | See what it's worth now |
| 6 Dec 2024 | £400,000 |
| 21 Jul 2022 | £425,000 |
20, Jellicoe Close, Eastbourne BN23 6DD
| Today | See what it's worth now |
| 29 Nov 2024 | £315,000 |
| 11 Jan 2007 | £182,000 |
No other historical records.
2a, Seaville Drive, Eastbourne BN23 6LD
| Today | See what it's worth now |
| 29 Nov 2024 | £342,500 |
| 11 May 2006 | £232,500 |
35, Wallis Avenue, Eastbourne BN23 6LR

| Today | See what it's worth now |
| 22 Nov 2024 | £300,000 |
| 23 Apr 2020 | £255,000 |
18, St Anthonys Avenue, Eastbourne BN23 6LB
| Today | See what it's worth now |
| 15 Nov 2024 | £580,000 |
| 3 Dec 1999 | £87,000 |
Get ready with a Mortgage in Principle
- Personalised result in just 20 minutes
- Find out how much you can borrow
- Get viewings faster with agents
- No impact on your credit score
What's your property worth?
Source Acknowledgement: © Crown copyright. England and Wales house price data is publicly available information produced by the HM Land Registry.This material was last updated on 11 June 2025. It covers the period from 1 January 1995 to 31 March 2025 and contains property transactions which have been registered during that period. Contains HM Land Registry data © Crown copyright and database right 2025. This data is licensed under the Open Government Licence v3.0.
Disclaimer: Rightmove.co.uk provides this HM Land Registry data "as is". The burden for fitness of the data relies completely with the user and is provided for informational purposes only. No warranty, express or implied, is given relating to the accuracy of content of the HM Land Registry data and Rightmove does not accept any liability for error or omission. If you have found an error with the data or need further information please contact HM Land Registry.
Permitted Use: Viewers of this Information are granted permission to access this Crown copyright material and to download it onto electronic, magnetic, optical or similar storage media provided that such activities are for private research, study or in-house use only. Any other use of the material requires the formal written permission of Land Registry which can be requested from us, and is subject to an additional licence and associated charge.
Map data ©OpenStreetMap contributors.
Rightmove takes no liability for your use of, or reliance on, Rightmove's Instant Valuation due to the limitations of our tracking tool listed here. Use of this tool is taken entirely at your own risk. All rights reserved.