
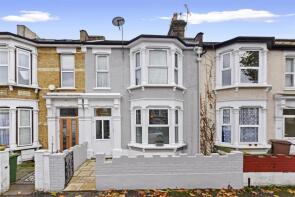
House Prices in Leytonstone
House prices in Leytonstone have an overall average of £613,992 over the last year.
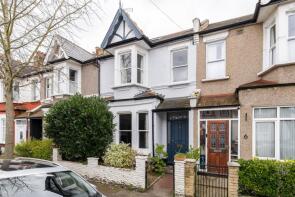
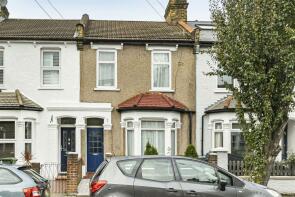
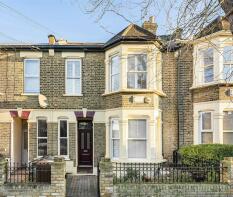
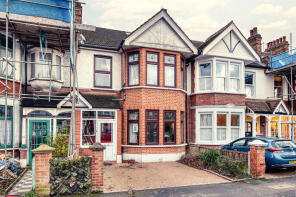
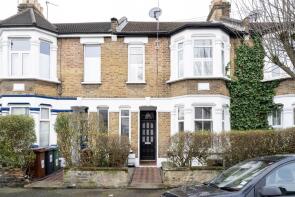
The majority of properties sold in Leytonstone during the last year were terraced properties, selling for an average price of £735,226. Flats sold for an average of £413,801, with semi-detached properties fetching £906,280.
Overall, the historical sold prices in Leytonstone over the last year were 4% up on the previous year and 10% up on the 2022 peak of £556,860.
Properties Sold
82, Warren Road, London E10 5QA
| Today | See what it's worth now |
| 24 Jun 2025 | £546,976 |
| 6 Apr 2021 | £360,850 |
100a Ground Floor, Napier Road, London E11 3JZ
| Today | See what it's worth now |
| 20 Jun 2025 | £400,000 |
| 5 Apr 2019 | £344,835 |
76a, Grove Green Road, London E11 4EL

| Today | See what it's worth now |
| 17 Jun 2025 | £483,000 |
| 10 Jun 2021 | £405,000 |
2, Francis Road, London E10 6PW
| Today | See what it's worth now |
| 12 Jun 2025 | £550,000 |
| 27 Jun 2022 | £513,250 |
No other historical records.
77, Francis Road, London E10 6PL


| Today | See what it's worth now |
| 11 Jun 2025 | £330,000 |
| 30 Aug 2013 | £205,000 |
No other historical records.
Ground Floor Flat 1, 39, Lincoln Street, Leytonstone E11 4PZ
| Today | See what it's worth now |
| 9 Jun 2025 | £402,000 |
| 13 Dec 2019 | £299,750 |
No other historical records.
8, Belgrave Road, London E10 6LD
| Today | See what it's worth now |
| 6 Jun 2025 | £875,000 |
| 5 Dec 2014 | £450,000 |
No other historical records.
9, Morley Road, London E10 6LJ
| Today | See what it's worth now |
| 6 Jun 2025 | £744,000 |
| 1 Oct 2004 | £230,500 |
No other historical records.
17, St Annes Road, London E11 4BP
| Today | See what it's worth now |
| 6 Jun 2025 | £621,500 |
| 10 Jan 2020 | £495,750 |
38, Frith Road, London E11 4EY

| Today | See what it's worth now |
| 5 Jun 2025 | £910,000 |
| 30 Jul 2014 | £445,000 |
No other historical records.
37, Stewart Road, London E15 2BA
| Today | See what it's worth now |
| 5 Jun 2025 | £675,000 |
| 23 Jul 2019 | £585,000 |
12, 362 Paramount House, High Road Leytonstone, London E11 3JS

| Today | See what it's worth now |
| 3 Jun 2025 | £253,000 |
| 24 Apr 2015 | £224,000 |
No other historical records.
13, 145 Woodbridge House, Mornington Road, London E11 3DZ

| Today | See what it's worth now |
| 3 Jun 2025 | £390,000 |
| 1 Aug 1997 | £48,000 |
No other historical records.
3, 105 Harriot Court, Hainault Road, London E11 1TA
| Today | See what it's worth now |
| 30 May 2025 | £288,000 |
| 26 Jun 2018 | £285,000 |
228, Murchison Road, London E10 6LU

| Today | See what it's worth now |
| 30 May 2025 | £825,000 |
| 20 Feb 2006 | £235,000 |
No other historical records.
42a, Cavendish Drive, Leytonstone E11 1DN
| Today | See what it's worth now |
| 30 May 2025 | £451,850 |
| 24 Jul 2019 | £328,000 |
8, Bulwer Court, Bulwer Court Road, London E11 1DB
| Today | See what it's worth now |
| 27 May 2025 | £425,000 |
| 6 Nov 2020 | £350,000 |
96, Ashville Road, Leytonstone E11 4DU

| Today | See what it's worth now |
| 27 May 2025 | £825,000 |
No other historical records.
60, Michael Road, Leytonstone E11 3DY
| Today | See what it's worth now |
| 23 May 2025 | £675,000 |
No other historical records.
13, St Annes Road, Leytonstone E11 4BP

| Today | See what it's worth now |
| 23 May 2025 | £511,000 |
No other historical records.
12, Richmond Way, Wanstead, London E11 3QT
| Today | See what it's worth now |
| 23 May 2025 | £960,000 |
| 7 Dec 2004 | £333,000 |
No other historical records.
14, West Street, Leytonstone E11 4LJ

| Today | See what it's worth now |
| 23 May 2025 | £510,000 |
No other historical records.
74, Scotts Road, London E10 6LW

| Today | See what it's worth now |
| 23 May 2025 | £620,000 |
| 13 Dec 2019 | £514,000 |
138, Grove Green Road, London E11 4EL

| Today | See what it's worth now |
| 22 May 2025 | £760,000 |
| 17 Jan 2020 | £300,000 |
50, Morley Road, London E10 6LL
| Today | See what it's worth now |
| 16 May 2025 | £575,000 |
| 16 Jun 2017 | £437,500 |
No other historical records.
Get ready with a Mortgage in Principle
- Personalised result in just 20 minutes
- Find out how much you can borrow
- Get viewings faster with agents
- No impact on your credit score
What's your property worth?
Source Acknowledgement: © Crown copyright. England and Wales house price data is publicly available information produced by the HM Land Registry.This material was last updated on 6 August 2025. It covers the period from 1 January 1995 to 30 June 2025 and contains property transactions which have been registered during that period. Contains HM Land Registry data © Crown copyright and database right 2025. This data is licensed under the Open Government Licence v3.0.
Disclaimer: Rightmove.co.uk provides this HM Land Registry data "as is". The burden for fitness of the data relies completely with the user and is provided for informational purposes only. No warranty, express or implied, is given relating to the accuracy of content of the HM Land Registry data and Rightmove does not accept any liability for error or omission. If you have found an error with the data or need further information please contact HM Land Registry.
Permitted Use: Viewers of this Information are granted permission to access this Crown copyright material and to download it onto electronic, magnetic, optical or similar storage media provided that such activities are for private research, study or in-house use only. Any other use of the material requires the formal written permission of Land Registry which can be requested from us, and is subject to an additional licence and associated charge.
Map data ©OpenStreetMap contributors.
Rightmove takes no liability for your use of, or reliance on, Rightmove's Instant Valuation due to the limitations of our tracking tool listed here. Use of this tool is taken entirely at your own risk. All rights reserved.