
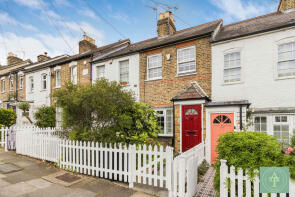
House Prices in N14
House prices in N14 have an overall average of £666,929 over the last year.
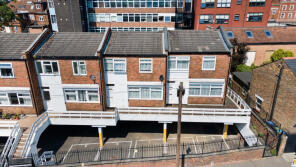
The majority of properties sold in N14 during the last year were semi-detached properties, selling for an average price of £841,996. Flats sold for an average of £394,257, with terraced properties fetching £696,260.
Overall, the historical sold prices in N14 over the last year were similar to the previous year and 6% down on the 2021 peak of £709,717.
Properties Sold
219, Bramley Road, London N14 4UY

| Today | See what it's worth now |
| 23 May 2025 | £737,000 |
| 28 Jun 1995 | £138,700 |
No other historical records.
63, Oakwood Avenue, London N14 6QH

| Today | See what it's worth now |
| 16 May 2025 | £960,000 |
| 30 Aug 2019 | £775,000 |
35, Celandine Grove, London N14 4BP

| Today | See what it's worth now |
| 13 May 2025 | £150,000 |
| 1 Mar 2022 | £105,000 |
15, Farmleigh, Southgate N14 5QJ


| Today | See what it's worth now |
| 8 May 2025 | £530,000 |
No other historical records.
20, The Rye, London N14 4LX
| Today | See what it's worth now |
| 14 Apr 2025 | £725,000 |
| 30 Jun 2004 | £390,000 |
No other historical records.
10, 2a Wooburn Court, Winchmore Hill Road, London N14 6PT
| Today | See what it's worth now |
| 31 Mar 2025 | £405,500 |
| 28 Jul 2005 | £314,995 |
No other historical records.
76, Oakwood Park Road, Southgate N14 6QA
| Today | See what it's worth now |
| 28 Mar 2025 | £825,000 |
No other historical records.
41, Chelmsford Road, London N14 5PS
| Today | See what it's worth now |
| 28 Mar 2025 | £595,000 |
| 13 Apr 2018 | £500,000 |
34, Orchard Avenue, London N14 4ND
| Today | See what it's worth now |
| 28 Mar 2025 | £625,000 |
| 25 Sep 2014 | £499,950 |
No other historical records.
7, Harlech Road, London N14 7BY

| Today | See what it's worth now |
| 27 Mar 2025 | £925,000 |
| 30 Jan 1995 | £127,000 |
No other historical records.
152, Chase Way, Southgate, London N14 5DH

| Today | See what it's worth now |
| 26 Mar 2025 | £826,000 |
| 1 Sep 1995 | £115,000 |
No other historical records.
12, 236 Hunt Court, Chase Side, London N14 4PG
| Today | See what it's worth now |
| 24 Mar 2025 | £537,075 |
| 2 Apr 2019 | £435,000 |
No other historical records.
Flat 4, 77, Selborne Road, Southgate N14 7DE
| Today | See what it's worth now |
| 24 Mar 2025 | £490,000 |
| 3 May 2023 | £475,000 |
No other historical records.
8, Knoll Drive, Southgate, London N14 5LT

| Today | See what it's worth now |
| 21 Mar 2025 | £860,000 |
| 19 Feb 2001 | £275,000 |
33, Crown Lane, Southgate N14 5EX
| Today | See what it's worth now |
| 21 Mar 2025 | £460,000 |
No other historical records.
134, The Vale, Southgate N14 6AY
| Today | See what it's worth now |
| 18 Mar 2025 | £865,000 |
No other historical records.
60, Chase Road, London N14 4ET

| Today | See what it's worth now |
| 18 Mar 2025 | £860,000 |
| 20 Dec 1996 | £142,000 |
No other historical records.
65a, Selborne Road, Southgate N14 7DE

| Today | See what it's worth now |
| 14 Mar 2025 | £625,000 |
No other historical records.
18, Greenacre Walk, London N14 7DB

| Today | See what it's worth now |
| 14 Mar 2025 | £550,000 |
| 9 Mar 2009 | £387,500 |
No other historical records.
141, The Fairway, London N14 4NJ
| Today | See what it's worth now |
| 10 Mar 2025 | £695,000 |
| 9 Dec 2005 | £330,000 |
223, Bramley Road, London N14 4UY
| Today | See what it's worth now |
| 7 Mar 2025 | £760,000 |
| 27 Feb 2006 | £425,000 |
6, Overton Road, Southgate N14 4SY
| Today | See what it's worth now |
| 7 Mar 2025 | £950,000 |
No other historical records.
5, 4a Lantern Court, Winchmore Hill Road, London N14 6PT

| Today | See what it's worth now |
| 5 Mar 2025 | £380,000 |
| 29 Nov 2018 | £398,000 |
3, Exeter Road, Southgate, London N14 5JT
| Today | See what it's worth now |
| 28 Feb 2025 | £727,000 |
No other historical records.
87, The Fairway, Southgate N14 4PB
| Today | See what it's worth now |
| 28 Feb 2025 | £600,000 |
No other historical records.
Find out how much your property is worth
The following agents can provide you with a free, no-obligation valuation. Simply select the ones you'd like to hear from.
Sponsored
All featured agents have paid a fee to promote their valuation expertise.

Barnard Cook
North London

Havilands
London

Bairstow Eves
Southgate

Charles Henry Peppiatt Ltd
London

Anthony Charles
Southgate
Get ready with a Mortgage in Principle
- Personalised result in just 20 minutes
- Find out how much you can borrow
- Get viewings faster with agents
- No impact on your credit score
What's your property worth?
Source Acknowledgement: © Crown copyright. England and Wales house price data is publicly available information produced by the HM Land Registry.This material was last updated on 16 July 2025. It covers the period from 1 January 1995 to 30 May 2025 and contains property transactions which have been registered during that period. Contains HM Land Registry data © Crown copyright and database right 2025. This data is licensed under the Open Government Licence v3.0.
Disclaimer: Rightmove.co.uk provides this HM Land Registry data "as is". The burden for fitness of the data relies completely with the user and is provided for informational purposes only. No warranty, express or implied, is given relating to the accuracy of content of the HM Land Registry data and Rightmove does not accept any liability for error or omission. If you have found an error with the data or need further information please contact HM Land Registry.
Permitted Use: Viewers of this Information are granted permission to access this Crown copyright material and to download it onto electronic, magnetic, optical or similar storage media provided that such activities are for private research, study or in-house use only. Any other use of the material requires the formal written permission of Land Registry which can be requested from us, and is subject to an additional licence and associated charge.
Map data ©OpenStreetMap contributors.
Rightmove takes no liability for your use of, or reliance on, Rightmove's Instant Valuation due to the limitations of our tracking tool listed here. Use of this tool is taken entirely at your own risk. All rights reserved.