
House Prices in Revidge
House prices in Revidge have an overall average of £180,204 over the last year.
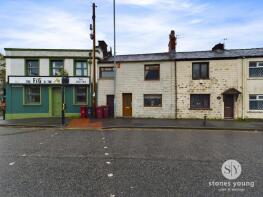
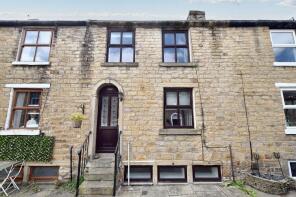
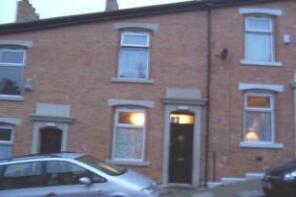
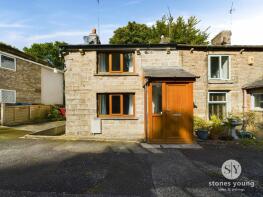
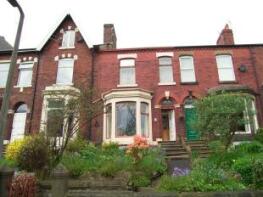
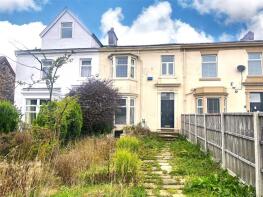
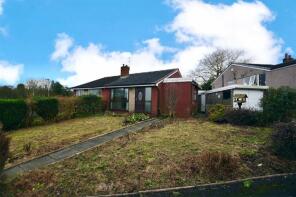
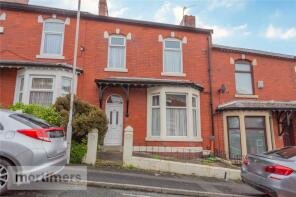
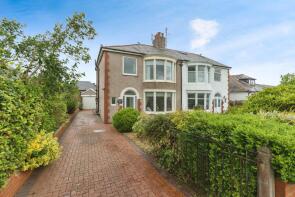
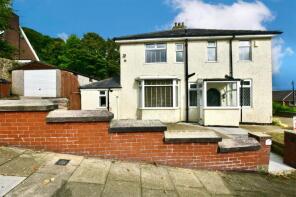
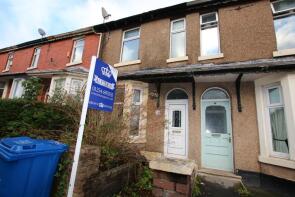
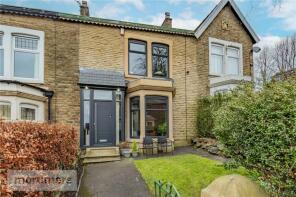
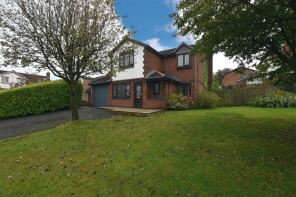
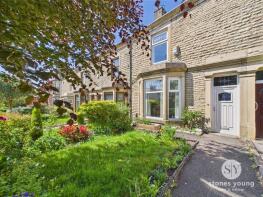
The majority of properties sold in Revidge during the last year were terraced properties, selling for an average price of £143,632. Semi-detached properties sold for an average of £203,787, with detached properties fetching £268,870.
Overall, the historical sold prices in Revidge over the last year were 2% up on the previous year and similar to the 2022 peak of £180,325.
Properties Sold
151, Leamington Road, Blackburn BB2 6HH


| Today | See what it's worth now |
| 19 May 2025 | £124,000 |
No other historical records.
252, Shear Brow, Blackburn BB1 8DS
| Today | See what it's worth now |
| 16 May 2025 | £107,250 |
| 7 Jul 2003 | £68,000 |
No other historical records.
16, West View Place, Blackburn BB2 6JG
| Today | See what it's worth now |
| 16 May 2025 | £138,000 |
| 12 Apr 2007 | £134,200 |
12, Bromley Street, Blackburn BB2 6LJ
| Today | See what it's worth now |
| 16 May 2025 | £90,000 |
| 2 Mar 2017 | £80,000 |
15, Aspinall Fold, Blackburn BB1 8PD
| Today | See what it's worth now |
| 14 May 2025 | £124,500 |
| 1 Sep 2022 | £53,334 |
59, Neath Close, Blackburn BB1 8JB
| Today | See what it's worth now |
| 14 May 2025 | £160,000 |
| 4 Dec 2006 | £49,500 |
No other historical records.
213, Revidge Road, Blackburn BB2 6DT
| Today | See what it's worth now |
| 13 May 2025 | £195,000 |
| 10 Jul 2000 | £59,950 |
No other historical records.
51, Azalea Road, Blackburn BB2 6LB

| Today | See what it's worth now |
| 1 May 2025 | £175,000 |
| 2 Aug 2013 | £100,000 |
73, Leamington Road, Blackburn BB2 6HG
| Today | See what it's worth now |
| 30 Apr 2025 | £177,000 |
| 10 Jan 2003 | £37,000 |
15, St James's Road, Blackburn BB1 8EP
| Today | See what it's worth now |
| 29 Apr 2025 | £110,000 |
| 25 Jan 2008 | £114,000 |
45, Alexandra Road, Blackburn BB2 6DW
| Today | See what it's worth now |
| 25 Apr 2025 | £200,000 |
| 17 Oct 2005 | £145,000 |
189, Revidge Road, Blackburn BB2 6DT
| Today | See what it's worth now |
| 23 Apr 2025 | £188,000 |
| 14 Nov 2014 | £180,000 |
No other historical records.
17, Edgeware Road, Blackburn BB2 6DS
| Today | See what it's worth now |
| 14 Apr 2025 | £180,000 |
| 12 Jan 2023 | £160,000 |
33, Fair Hope Court, Harcourt Road, Blackburn BB2 6HX

| Today | See what it's worth now |
| 14 Apr 2025 | £73,000 |
| 20 Dec 2002 | £42,000 |
27, Royshaw Avenue, Blackburn BB1 8RJ
| Today | See what it's worth now |
| 11 Apr 2025 | £120,000 |
No other historical records.
78, Azalea Road, Blackburn BB2 6LB
| Today | See what it's worth now |
| 28 Mar 2025 | £160,000 |
| 24 Oct 2014 | £118,000 |
74, Ramsgreave Drive, Blackburn BB1 8NB
| Today | See what it's worth now |
| 28 Mar 2025 | £235,000 |
No other historical records.
59, Buncer Lane, Blackburn BB2 6SN

| Today | See what it's worth now |
| 28 Mar 2025 | £249,000 |
| 28 Sep 2017 | £172,500 |
No other historical records.
27, Gorse Road, Blackburn BB2 6LZ
| Today | See what it's worth now |
| 28 Mar 2025 | £250,000 |
| 26 Nov 2021 | £160,000 |
20, Albany Road, Blackburn BB2 6EQ
| Today | See what it's worth now |
| 27 Mar 2025 | £143,000 |
| 31 Jan 2022 | £152,000 |
61, Revidge Road, Blackburn BB2 6JH
| Today | See what it's worth now |
| 24 Mar 2025 | £278,000 |
| 1 Dec 2017 | £148,000 |
No other historical records.
16a, Pleckgate Fold, Blackburn BB1 8QB

| Today | See what it's worth now |
| 21 Mar 2025 | £293,000 |
| 11 Feb 2022 | £222,500 |
No other historical records.
4, Curlew Close, Blackburn BB1 8NT
| Today | See what it's worth now |
| 21 Mar 2025 | £350,000 |
| 25 Feb 2020 | £252,000 |
No other historical records.
21, Revidge Road, Blackburn BB2 6JB
| Today | See what it's worth now |
| 21 Mar 2025 | £185,000 |
| 7 May 1999 | £59,950 |
No other historical records.
14, Irving Place, Blackburn BB2 6LR

| Today | See what it's worth now |
| 21 Mar 2025 | £110,000 |
| 28 Aug 2014 | £140,000 |
No other historical records.
Get ready with a Mortgage in Principle
- Personalised result in just 20 minutes
- Find out how much you can borrow
- Get viewings faster with agents
- No impact on your credit score
What's your property worth?
Source Acknowledgement: © Crown copyright. England and Wales house price data is publicly available information produced by the HM Land Registry.This material was last updated on 6 August 2025. It covers the period from 1 January 1995 to 30 June 2025 and contains property transactions which have been registered during that period. Contains HM Land Registry data © Crown copyright and database right 2025. This data is licensed under the Open Government Licence v3.0.
Disclaimer: Rightmove.co.uk provides this HM Land Registry data "as is". The burden for fitness of the data relies completely with the user and is provided for informational purposes only. No warranty, express or implied, is given relating to the accuracy of content of the HM Land Registry data and Rightmove does not accept any liability for error or omission. If you have found an error with the data or need further information please contact HM Land Registry.
Permitted Use: Viewers of this Information are granted permission to access this Crown copyright material and to download it onto electronic, magnetic, optical or similar storage media provided that such activities are for private research, study or in-house use only. Any other use of the material requires the formal written permission of Land Registry which can be requested from us, and is subject to an additional licence and associated charge.
Map data ©OpenStreetMap contributors.
Rightmove takes no liability for your use of, or reliance on, Rightmove's Instant Valuation due to the limitations of our tracking tool listed here. Use of this tool is taken entirely at your own risk. All rights reserved.