
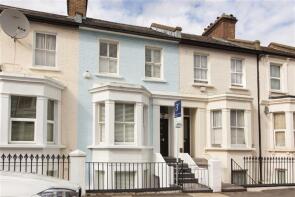
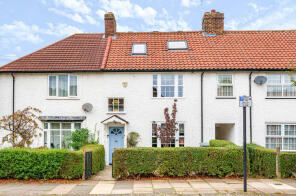
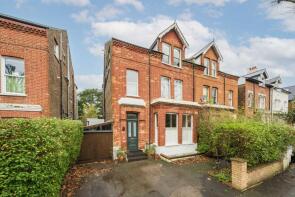
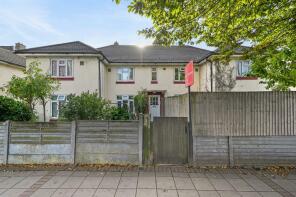
House Prices in W3
House prices in W3 have an overall average of £619,171 over the last year.
The majority of properties sold in W3 during the last year were flats, selling for an average price of £436,629. Terraced properties sold for an average of £892,729, with semi-detached properties fetching £1,065,228.
Overall, the historical sold prices in W3 over the last year were similar to the previous year and 1% up on the 2021 peak of £611,770.
Properties Sold
Flat 35, Napier House, Bromyard Avenue, London W3 7FF
| Today | See what it's worth now |
| 19 Jun 2025 | £320,000 |
| 27 Jul 2012 | £247,975 |
No other historical records.
5b, Birkbeck Grove, Acton W3 7QD
| Today | See what it's worth now |
| 12 Jun 2025 | £271,000 |
No other historical records.
16, Alacia Court, Palmerston Road, London W3 8GJ
| Today | See what it's worth now |
| 6 Jun 2025 | £370,000 |
| 18 Mar 2019 | £387,000 |
20, 194 210 Pegasus Court, Horn Lane, London W3 6PT
| Today | See what it's worth now |
| 3 Jun 2025 | £185,000 |
| 27 May 2016 | £245,000 |
8, Cromwell Close, London W3 6BN

| Today | See what it's worth now |
| 30 May 2025 | £322,000 |
| 13 Nov 2003 | £182,500 |
55, Chatsworth Gardens, London W3 9LP

| Today | See what it's worth now |
| 30 May 2025 | £1,415,000 |
| 6 Dec 2013 | £1,105,000 |
71, Court Way, London W3 0PY
| Today | See what it's worth now |
| 27 May 2025 | £835,000 |
| 11 Aug 2014 | £700,000 |
No other historical records.
Flat 558, Bromyard House, Bromyard Avenue, Acton W3 7FG

| Today | See what it's worth now |
| 20 May 2025 | £350,000 |
No other historical records.
55, Acton Town Hall Apartments, Winchester Street, London W3 8UH


| Today | See what it's worth now |
| 16 May 2025 | £475,000 |
| 7 Dec 2020 | £540,000 |
No other historical records.
6, Kirkwall House, Churchfield Road, Acton W3 6LQ

| Today | See what it's worth now |
| 15 May 2025 | £95,000 |
No other historical records.
23, Birkbeck Grove, London W3 7QD
| Today | See what it's worth now |
| 13 May 2025 | £965,000 |
| 12 May 2006 | £330,000 |
No other historical records.
32, Ashfield Road, Acton W3 7JJ
| Today | See what it's worth now |
| 8 May 2025 | £925,000 |
No other historical records.
28, Chaucer Road, London W3 6DR
| Today | See what it's worth now |
| 2 May 2025 | £1,270,000 |
| 11 Jan 2016 | £975,000 |
51, Ramsay Road, Acton W3 8AZ

| Today | See what it's worth now |
| 1 May 2025 | £680,000 |
No other historical records.
3, Birkbeck Avenue, London W3 6HX
| Today | See what it's worth now |
| 1 May 2025 | £625,000 |
| 25 Jun 2021 | £555,000 |
Flat 1, 11, Goldsmith Road, London W3 6PX
| Today | See what it's worth now |
| 1 May 2025 | £320,000 |
| 9 Oct 2018 | £312,500 |
10, Drummond Court, Palmerston Road, London W3 8FP

| Today | See what it's worth now |
| 1 May 2025 | £370,000 |
| 16 Dec 2016 | £410,000 |
Flat 1, 25, Willcott Road, Acton W3 9QX

| Today | See what it's worth now |
| 30 Apr 2025 | £641,000 |
| 7 Aug 2020 | £585,000 |
No other historical records.
6, Park Drive, Acton, London W3 8NA
| Today | See what it's worth now |
| 29 Apr 2025 | £750,000 |
| 30 Aug 1996 | £120,000 |
No other historical records.
50, Saxon Drive, London W3 0NR
| Today | See what it's worth now |
| 25 Apr 2025 | £879,500 |
| 17 Jan 2020 | £613,000 |
Flat 3, 12, Heathfield Road, Acton W3 8EL
| Today | See what it's worth now |
| 25 Apr 2025 | £548,000 |
| 30 Oct 2009 | £315,000 |
98, Wales Farm Road, London W3 6UF
| Today | See what it's worth now |
| 25 Apr 2025 | £385,000 |
| 25 May 2011 | £244,950 |
No other historical records.
139a, Valetta Road, London W3 7TA

| Today | See what it's worth now |
| 22 Apr 2025 | £850,000 |
| 13 Feb 2012 | £395,000 |
No other historical records.
2, Portree House, Stromness Walk, London W3 6GW

| Today | See what it's worth now |
| 17 Apr 2025 | £360,000 |
| 6 Nov 2020 | £148,000 |
No other historical records.
Flat 185, Napier House, Bromyard Avenue, London W3 7FL

| Today | See what it's worth now |
| 17 Apr 2025 | £615,000 |
| 18 Oct 2012 | £460,000 |
No other historical records.
Find out how much your property is worth
The following agents can provide you with a free, no-obligation valuation. Simply select the ones you'd like to hear from.
Sponsored
All featured agents have paid a fee to promote their valuation expertise.

Rolfe East
Acton

Portico
Shepherds Bush - Sales

Barnard Marcus
Ealing

Knight Frank
Chiswick

Aston Rowe
Acton
Get ready with a Mortgage in Principle
- Personalised result in just 20 minutes
- Find out how much you can borrow
- Get viewings faster with agents
- No impact on your credit score
What's your property worth?
Source Acknowledgement: © Crown copyright. England and Wales house price data is publicly available information produced by the HM Land Registry.This material was last updated on 6 August 2025. It covers the period from 1 January 1995 to 30 June 2025 and contains property transactions which have been registered during that period. Contains HM Land Registry data © Crown copyright and database right 2025. This data is licensed under the Open Government Licence v3.0.
Disclaimer: Rightmove.co.uk provides this HM Land Registry data "as is". The burden for fitness of the data relies completely with the user and is provided for informational purposes only. No warranty, express or implied, is given relating to the accuracy of content of the HM Land Registry data and Rightmove does not accept any liability for error or omission. If you have found an error with the data or need further information please contact HM Land Registry.
Permitted Use: Viewers of this Information are granted permission to access this Crown copyright material and to download it onto electronic, magnetic, optical or similar storage media provided that such activities are for private research, study or in-house use only. Any other use of the material requires the formal written permission of Land Registry which can be requested from us, and is subject to an additional licence and associated charge.
Data on planning applications, home extensions and build costs is provided by Resi.co.uk. Planning data is calculated using the last 2 years of residential applications within the selected planning authority. Home extension data, such as build costs and project timelines, are calculated using approximately 9,000 architectural projects Resi has completed, and 23,500 builders quotes submitted via Resi's platform. Build costs are adjusted according to inflation rates to more accurately represent today's prices.
Map data ©OpenStreetMap contributors.
Rightmove takes no liability for your use of, or reliance on, Rightmove's Instant Valuation due to the limitations of our tracking tool listed here. Use of this tool is taken entirely at your own risk. All rights reserved.