
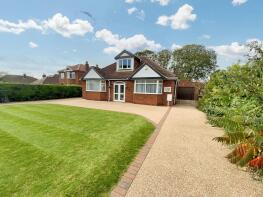
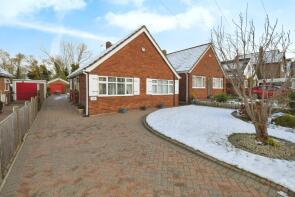
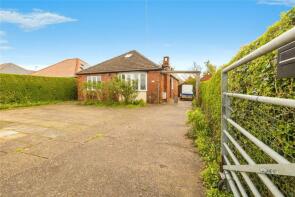
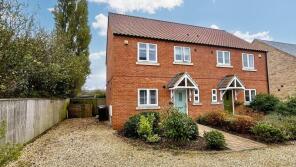
House Prices in Waddington
House prices in Waddington have an overall average of £253,125 over the last year.
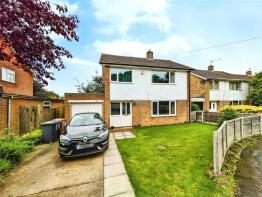
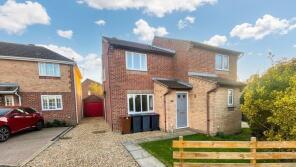
The majority of properties sold in Waddington during the last year were detached properties, selling for an average price of £280,630. Semi-detached properties sold for an average of £216,961, with terraced properties fetching £225,375.
Overall, the historical sold prices in Waddington over the last year were 8% up on the previous year and similar to the 2022 peak of £254,809.
Properties Sold
45, Melbourne Way, Waddington, Lincoln LN5 9XJ
| Today | See what it's worth now |
| 23 Jun 2025 | £145,000 |
| 29 Jan 2020 | £238,000 |
311 Wesmay House, Brant Road, Waddington, Lincoln LN5 9AQ

| Today | See what it's worth now |
| 18 Jun 2025 | £236,750 |
| 24 Oct 2017 | £186,000 |
7, Cairns Way, Waddington, Lincoln LN5 9UB
| Today | See what it's worth now |
| 3 Jun 2025 | £240,000 |
| 12 Apr 2001 | £77,000 |
No other historical records.
18, Cole Avenue, Waddington, Lincoln LN5 9TF
| Today | See what it's worth now |
| 30 May 2025 | £229,000 |
| 28 Aug 2020 | £204,950 |
No other historical records.
319, Brant Road, Waddington, Lincoln LN5 9AQ
| Today | See what it's worth now |
| 27 May 2025 | £218,000 |
| 31 Mar 2021 | £220,000 |
26, Grafham Drive, Waddington, Lincoln LN5 9FX
| Today | See what it's worth now |
| 23 May 2025 | £255,000 |
| 1 Sep 2016 | £195,000 |
16, Boone Close, Waddington, Lincoln LN5 9ZJ
| Today | See what it's worth now |
| 2 May 2025 | £245,000 |
| 27 Aug 2021 | £228,000 |
No other historical records.
148, Station Road, Waddington, Lincoln LN5 9QS
| Today | See what it's worth now |
| 2 May 2025 | £240,000 |
| 4 Apr 2019 | £190,000 |
386, Brant Road, Waddington, Lincoln LN5 9AN
| Today | See what it's worth now |
| 30 Apr 2025 | £295,000 |
| 26 Jan 2021 | £170,000 |
No other historical records.
84 Honeybee Cottage, Grantham Road, Waddington, Lincoln LN5 9NT
| Today | See what it's worth now |
| 30 Apr 2025 | £450,000 |
| 14 Dec 2018 | £234,000 |
Hillcroft Cottage, High Street, Waddington, Lincoln LN5 9RF
| Today | See what it's worth now |
| 29 Apr 2025 | £225,000 |
| 31 Oct 2019 | £170,000 |
No other historical records.
18, Newport Crescent, Waddington, Lincoln LN5 9LZ
| Today | See what it's worth now |
| 23 Apr 2025 | £255,000 |
| 21 Feb 2023 | £212,800 |
29, Pitsford Close, Waddington, Lincoln LN5 9FY
| Today | See what it's worth now |
| 22 Apr 2025 | £210,000 |
| 16 Dec 2016 | £174,995 |
No other historical records.
April Cottage, Lower High Street, Waddington, Lincoln LN5 9QA
| Today | See what it's worth now |
| 17 Apr 2025 | £255,500 |
| 7 Dec 2001 | £125,000 |
2, Coupland Close, Waddington, Lincoln LN5 9NW
| Today | See what it's worth now |
| 11 Apr 2025 | £390,000 |
| 1 Oct 2002 | £188,000 |
No other historical records.
5, Fir Tree Avenue, Waddington, Lincoln LN5 9DP
| Today | See what it's worth now |
| 4 Apr 2025 | £255,000 |
| 15 Oct 2021 | £235,000 |
57, Somerville Close, Waddington, Lincoln LN5 9QP


| Today | See what it's worth now |
| 31 Mar 2025 | £190,000 |
No other historical records.
9, Marina Close, Waddington, Lincoln LN5 9NL
| Today | See what it's worth now |
| 28 Mar 2025 | £180,000 |
| 18 Oct 2019 | £148,500 |
The Owls, Grantham Road, Waddington, Lincoln LN5 9NU
| Today | See what it's worth now |
| 26 Mar 2025 | £350,000 |
No other historical records.
27, Somerville Close, Waddington, Lincoln LN5 9QP
| Today | See what it's worth now |
| 26 Mar 2025 | £193,000 |
No other historical records.
41, Grantham Road, Waddington, Lincoln LN5 9LS
| Today | See what it's worth now |
| 26 Mar 2025 | £220,000 |
| 7 Mar 2001 | £67,000 |
No other historical records.
9, Meadowfield Close, Waddington, Lincoln LN5 9AA
| Today | See what it's worth now |
| 26 Mar 2025 | £231,500 |
| 28 Apr 2023 | £230,000 |
108, Grantham Road, Waddington, Lincoln LN5 9NT
| Today | See what it's worth now |
| 21 Mar 2025 | £260,000 |
| 27 Aug 2021 | £245,000 |
4, Adelaide Close, Waddington, Lincoln LN5 9XN
| Today | See what it's worth now |
| 13 Mar 2025 | £182,500 |
| 26 Apr 2021 | £155,000 |
Cliff Cottage, Timms Lane, Waddington, Lincoln LN5 9RQ
| Today | See what it's worth now |
| 4 Mar 2025 | £490,000 |
| 14 Jul 2016 | £382,500 |
No other historical records.
Get ready with a Mortgage in Principle
- Personalised result in just 20 minutes
- Find out how much you can borrow
- Get viewings faster with agents
- No impact on your credit score
What's your property worth?
Source Acknowledgement: © Crown copyright. England and Wales house price data is publicly available information produced by the HM Land Registry.This material was last updated on 6 August 2025. It covers the period from 1 January 1995 to 30 June 2025 and contains property transactions which have been registered during that period. Contains HM Land Registry data © Crown copyright and database right 2025. This data is licensed under the Open Government Licence v3.0.
Disclaimer: Rightmove.co.uk provides this HM Land Registry data "as is". The burden for fitness of the data relies completely with the user and is provided for informational purposes only. No warranty, express or implied, is given relating to the accuracy of content of the HM Land Registry data and Rightmove does not accept any liability for error or omission. If you have found an error with the data or need further information please contact HM Land Registry.
Permitted Use: Viewers of this Information are granted permission to access this Crown copyright material and to download it onto electronic, magnetic, optical or similar storage media provided that such activities are for private research, study or in-house use only. Any other use of the material requires the formal written permission of Land Registry which can be requested from us, and is subject to an additional licence and associated charge.
Map data ©OpenStreetMap contributors.
Rightmove takes no liability for your use of, or reliance on, Rightmove's Instant Valuation due to the limitations of our tracking tool listed here. Use of this tool is taken entirely at your own risk. All rights reserved.