
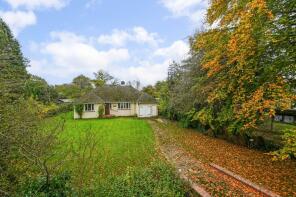
House Prices in Brook
House prices in Brook have an overall average of £535,600 over the last year.
Overall, the historical sold prices in Brook over the last year were 4% down on the previous year and 39% down on the 2019 peak of £878,633.
Properties Sold
Myowna Lodge, The Street, Brook TN25 5PE
| Today | See what it's worth now |
| 16 May 2025 | £430,000 |
No other historical records.
Pear Tree Farm, Plumpton, Ashford TN25 5PS
| Today | See what it's worth now |
| 26 Feb 2025 | £910,000 |
| 21 Aug 2002 | £397,000 |
Jasmine Barn, Kiln Place, Naccolt, Wye TN25 5FA


| Today | See what it's worth now |
| 22 Oct 2024 | £225,000 |
No other historical records.
Crete, The Street, Ashford TN25 5PF
| Today | See what it's worth now |
| 14 Oct 2024 | £675,000 |
| 8 Dec 2009 | £325,000 |
Oast Meadow, The Street, Ashford TN25 5PG

| Today | See what it's worth now |
| 13 Sep 2024 | £438,000 |
| 21 Nov 2002 | £230,000 |
No other historical records.
Honeymead, Stonebridge, Ashford TN25 5PJ
| Today | See what it's worth now |
| 11 Jul 2024 | £457,000 |
| 5 Jul 2001 | £129,500 |
Glebeland, The Street, Ashford TN25 5PF
| Today | See what it's worth now |
| 21 Dec 2023 | £560,000 |
No other historical records.
Silver Hills, The Street, Ashford TN25 5PG
| Today | See what it's worth now |
| 1 Sep 2023 | �£650,000 |
No other historical records.
Mile Ash, The Street, Ashford TN25 5PG
| Today | See what it's worth now |
| 26 Aug 2022 | £1,200,000 |
| 4 Aug 2016 | £505,000 |
No other historical records.
3, Brookbank, The Street, Ashford TN25 5PE
| Today | See what it's worth now |
| 14 Feb 2022 | £425,000 |
No other historical records.
Trenance, Stonebridge, Ashford TN25 5PJ
| Today | See what it's worth now |
| 25 Feb 2021 | £550,000 |
| 7 Jan 2015 | £360,000 |
No other historical records.
Byland, Stonebridge, Ashford TN25 5PJ
| Today | See what it's worth now |
| 21 Jan 2021 | £445,000 |
| 7 Nov 1997 | £105,000 |
Brookfield, The Street, Ashford TN25 5PF
| Today | See what it's worth now |
| 19 Nov 2020 | £675,000 |
| 19 Jul 2011 | £382,000 |
Freshfields, Nats Lane, Ashford TN25 5PH
| Today | See what it's worth now |
| 31 Jan 2020 | £475,000 |
| 1 Dec 2003 | £320,000 |
No other historical records.
Whitegates, Spelders Hill, Ashford TN25 5PD
| Today | See what it's worth now |
| 10 Jan 2020 | £460,000 |
No other historical records.
Spelders Hill House, Spelders Hill, Ashford TN25 5PB
| Today | See what it's worth now |
| 25 Oct 2019 | £1,195,900 |
No other historical records.
Brook Farm House, The Street, Ashford TN25 5PF
| Today | See what it's worth now |
| 24 Jun 2019 | £1,040,000 |
| 14 Jul 2017 | £1,100,000 |
Brendon, Nats Lane, Ashford TN25 5PH
| Today | See what it's worth now |
| 8 May 2019 | £400,000 |
| 18 May 2001 | £130,000 |
No other historical records.
Bethel, The Street, Ashford TN25 5PF
| Today | See what it's worth now |
| 2 Nov 2018 | £395,000 |
No other historical records.
Nuthatch, Brabourne Road, Ashford TN25 5PP
| Today | See what it's worth now |
| 11 Sep 2018 | £815,000 |
| 27 Nov 1998 | £135,000 |
No other historical records.
Merebridge House, Nats Lane, Ashford TN25 5PH
| Today | See what it's worth now |
| 22 Mar 2018 | £1,092,500 |
| 9 Nov 2001 | £390,000 |
4, Pottery Cottages, Naccolt Road, Naccolt, Ashford TN25 5NX
| Today | See what it's worth now |
| 21 Feb 2018 | £375,000 |
| 9 Sep 2005 | £235,000 |
The Oast House, The Street, Ashford TN25 5PG
| Today | See what it's worth now |
| 2 Feb 2018 | £625,000 |
No other historical records.
Brookwood, The Street, Ashford TN25 5PF
| Today | See what it's worth now |
| 23 Feb 2017 | £475,000 |
No other historical records.
Ennerdale, Nats Lane, Ashford TN25 5PH

| Today | See what it's worth now |
| 14 Nov 2016 | £435,000 |
| 23 May 2013 | £265,000 |
No other historical records.
Get ready with a Mortgage in Principle
- Personalised result in just 20 minutes
- Find out how much you can borrow
- Get viewings faster with agents
- No impact on your credit score
What's your property worth?
Source Acknowledgement: © Crown copyright. England and Wales house price data is publicly available information produced by the HM Land Registry.This material was last updated on 6 August 2025. It covers the period from 1 January 1995 to 30 June 2025 and contains property transactions which have been registered during that period. Contains HM Land Registry data © Crown copyright and database right 2025. This data is licensed under the Open Government Licence v3.0.
Disclaimer: Rightmove.co.uk provides this HM Land Registry data "as is". The burden for fitness of the data relies completely with the user and is provided for informational purposes only. No warranty, express or implied, is given relating to the accuracy of content of the HM Land Registry data and Rightmove does not accept any liability for error or omission. If you have found an error with the data or need further information please contact HM Land Registry.
Permitted Use: Viewers of this Information are granted permission to access this Crown copyright material and to download it onto electronic, magnetic, optical or similar storage media provided that such activities are for private research, study or in-house use only. Any other use of the material requires the formal written permission of Land Registry which can be requested from us, and is subject to an additional licence and associated charge.
Map data ©OpenStreetMap contributors.
Rightmove takes no liability for your use of, or reliance on, Rightmove's Instant Valuation due to the limitations of our tracking tool listed here. Use of this tool is taken entirely at your own risk. All rights reserved.