
House Prices in CA7
House prices in CA7 have an overall average of £229,433 over the last year.
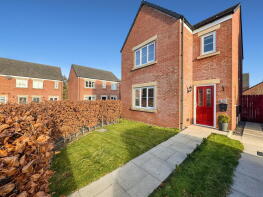
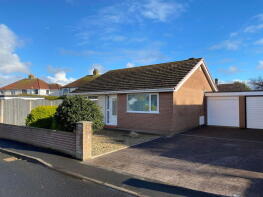
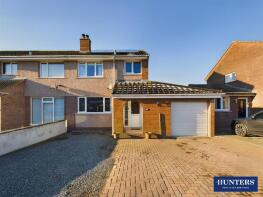
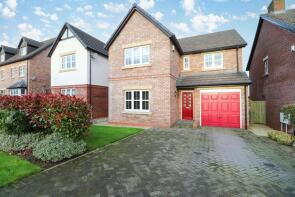
The majority of properties sold in CA7 during the last year were detached properties, selling for an average price of £302,020. Semi-detached properties sold for an average of £197,511, with terraced properties fetching £150,721.
Overall, the historical sold prices in CA7 over the last year were 8% up on the previous year and 4% up on the 2022 peak of £220,487.
Properties Sold
15, Links Close, Wigton CA7 4ES
| Today | See what it's worth now |
| 10 Jun 2025 | £173,000 |
| 27 Feb 1998 | £47,000 |
2, Pinegrove, Mealsgate CA7 1BY
| Today | See what it's worth now |
| 10 Jun 2025 | £189,000 |
No other historical records.
11, Ellen Close, Wigton CA7 9SD
| Today | See what it's worth now |
| 2 Jun 2025 | £90,000 |
| 30 Apr 1999 | £24,500 |
No other historical records.
34, Highmoor Park, Wigton CA7 9NA
| Today | See what it's worth now |
| 2 Jun 2025 | £192,000 |
| 10 Jan 2020 | £155,000 |
No other historical records.
100, Scholars Green, Wigton CA7 9BT
| Today | See what it's worth now |
| 30 May 2025 | £130,000 |
| 21 Dec 2016 | £115,000 |
3, Outgang Road, Wigton CA7 3HW
| Today | See what it's worth now |
| 30 May 2025 | £219,000 |
| 27 May 2008 | £200,000 |
No other historical records.
192, Skinburness Road, Skinburness CA7 4QS
| Today | See what it's worth now |
| 30 May 2025 | £275,000 |
| 12 Oct 2007 | £215,000 |
No other historical records.
90, Scholars Green, Wigton CA7 9BT
| Today | See what it's worth now |
| 30 May 2025 | £245,000 |
| 21 Sep 2018 | £180,000 |
4, Skinburness Crescent, Wigton CA7 4QL
| Today | See what it's worth now |
| 28 May 2025 | £180,000 |
| 4 Dec 2023 | £168,000 |
6, Deer Park, Wigton CA7 9ND
| Today | See what it's worth now |
| 23 May 2025 | £235,000 |
| 18 Aug 2023 | £220,000 |
15, Grange Close, Wigton CA7 9EF
| Today | See what it's worth now |
| 23 May 2025 | £310,000 |
| 5 Mar 2014 | £234,580 |
No other historical records.
2, Chatsworth Square, Wigton CA7 4RH
| Today | See what it's worth now |
| 21 May 2025 | �£89,950 |
| 12 May 2020 | £55,000 |
6, Beaconsfield Terrace, Silloth CA7 4HE
| Today | See what it's worth now |
| 16 May 2025 | £108,000 |
| 30 Mar 2016 | £75,000 |
20, Lawson Street, Wigton CA7 3DS
| Today | See what it's worth now |
| 8 May 2025 | £47,500 |
| 29 Aug 1997 | £27,000 |
No other historical records.
47, Market Hill, Wigton CA7 9EY
| Today | See what it's worth now |
| 2 May 2025 | £105,000 |
| 5 Sep 2014 | £94,000 |
Stocks Garth, B5305 Rosley, Wigton CA7 8BZ
| Today | See what it's worth now |
| 1 May 2025 | £530,000 |
| 25 Aug 2017 | £345,000 |
1, Grainger Houses, Access Road To Grainger Houses From A595 Thursby To Bothel, Wigton CA7 8LP
| Today | See what it's worth now |
| 30 Apr 2025 | £397,000 |
| 1 Sep 2006 | £235,000 |
55, St Cuthberts Close, Burnfoot, Wigton CA7 9GQ
| Today | See what it's worth now |
| 30 Apr 2025 | £235,000 |
| 25 Apr 2019 | £177,500 |
No other historical records.
7a, Johannah Terrace, Aspatria CA7 2AU
| Today | See what it's worth now |
| 30 Apr 2025 | £147,000 |
No other historical records.
3, Skinburness Court, Wigton CA7 4QN
| Today | See what it's worth now |
| 30 Apr 2025 | £130,000 |
| 1 Feb 2013 | £95,000 |
No other historical records.
54, Springfields, Wigton CA7 9JS
| Today | See what it's worth now |
| 25 Apr 2025 | £195,000 |
| 24 Aug 2020 | £140,000 |
6, Belfry Way, Wigton CA7 9SR
| Today | See what it's worth now |
| 25 Apr 2025 | £200,000 |
| 16 Feb 2024 | £199,495 |
No other historical records.
1, The Barns, Fingland Village, Fingland, Wigton CA7 5EN
| Today | See what it's worth now |
| 24 Apr 2025 | £385,000 |
| 27 Feb 2002 | £105,000 |
1, Allhallows Terrace, Fletchertown CA7 1BH
| Today | See what it's worth now |
| 23 Apr 2025 | £147,000 |
| 22 Dec 2021 | £142,000 |
No other historical records.
5, Prospect Place, Wigton CA7 4HQ
| Today | See what it's worth now |
| 17 Apr 2025 | £123,000 |
| 9 May 2014 | £79,000 |
Find out how much your property is worth
The following agents can provide you with a free, no-obligation valuation. Simply select the ones you'd like to hear from.
Sponsored
All featured agents have paid a fee to promote their valuation expertise.

Cumbrian Properties
Carlisle

Tiffen & Co
Carlisle

Northwood
Carlisle

H&H Land & Estates
Carlisle

H&H Land & Estates
Penrith

Hunters
Carlisle
Get ready with a Mortgage in Principle
- Personalised result in just 20 minutes
- Find out how much you can borrow
- Get viewings faster with agents
- No impact on your credit score
What's your property worth?
Source Acknowledgement: © Crown copyright. England and Wales house price data is publicly available information produced by the HM Land Registry.This material was last updated on 6 August 2025. It covers the period from 1 January 1995 to 30 June 2025 and contains property transactions which have been registered during that period. Contains HM Land Registry data © Crown copyright and database right 2025. This data is licensed under the Open Government Licence v3.0.
Disclaimer: Rightmove.co.uk provides this HM Land Registry data "as is". The burden for fitness of the data relies completely with the user and is provided for informational purposes only. No warranty, express or implied, is given relating to the accuracy of content of the HM Land Registry data and Rightmove does not accept any liability for error or omission. If you have found an error with the data or need further information please contact HM Land Registry.
Permitted Use: Viewers of this Information are granted permission to access this Crown copyright material and to download it onto electronic, magnetic, optical or similar storage media provided that such activities are for private research, study or in-house use only. Any other use of the material requires the formal written permission of Land Registry which can be requested from us, and is subject to an additional licence and associated charge.
Data on planning applications, home extensions and build costs is provided by Resi.co.uk. Planning data is calculated using the last 2 years of residential applications within the selected planning authority. Home extension data, such as build costs and project timelines, are calculated using approximately 9,000 architectural projects Resi has completed, and 23,500 builders quotes submitted via Resi's platform. Build costs are adjusted according to inflation rates to more accurately represent today's prices.
Map data ©OpenStreetMap contributors.
Rightmove takes no liability for your use of, or reliance on, Rightmove's Instant Valuation due to the limitations of our tracking tool listed here. Use of this tool is taken entirely at your own risk. All rights reserved.