
House Prices in CF44
House prices in CF44 have an overall average of £170,799 over the last year.
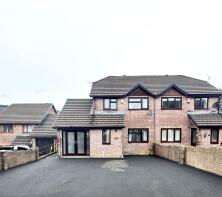
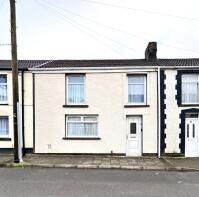
The majority of properties sold in CF44 during the last year were terraced properties, selling for an average price of £128,988. Semi-detached properties sold for an average of £185,052, with detached properties fetching £278,798.
Overall, the historical sold prices in CF44 over the last year were 2% up on the previous year and 2% up on the 2022 peak of £167,489.
Properties Sold
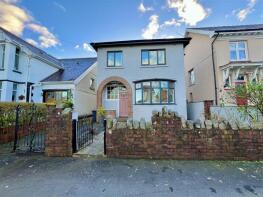
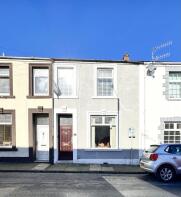
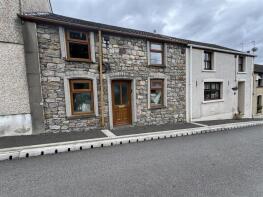
Lulworth, Brynawel, Aberdare CF44 7PF
| Today | See what it's worth now |
| 20 Jun 2025 | £265,000 |
| 16 Nov 2015 | £158,000 |
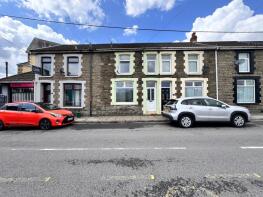
57, Jubilee Road, Aberaman, Aberdare CF44 6DD
| Today | See what it's worth now |
| 20 Jun 2025 | £139,000 |
| 23 Dec 2020 | £83,000 |
41, Monk Street, Aberdare CF44 7RF


| Today | See what it's worth now |
| 20 Jun 2025 | £172,000 |
| 5 Dec 2024 | £168,000 |
11, Windsor Terrace, Abernant Road, Aber-nant, Aberdare CF44 0SG

| Today | See what it's worth now |
| 12 Jun 2025 | £35,000 |
| 4 Dec 2018 | £137,500 |
2, Y Garth, Cwmdare, Aberdare CF44 8TG
| Today | See what it's worth now |
| 10 Jun 2025 | £61,000 |
| 26 Sep 2007 | £56,000 |
No other historical records.
10, Brookbank Close, Cwm-bach, Aberdare CF44 0JG
| Today | See what it's worth now |
| 9 Jun 2025 | £150,000 |
| 16 Oct 2001 | £56,500 |
9, Seymour Street, Aberdare CF44 7BL
| Today | See what it's worth now |
| 6 Jun 2025 | £107,500 |
| 30 Nov 2018 | £71,500 |
No other historical records.
19, Cascade View, Cwmdare, Aberdare CF44 8PN
| Today | See what it's worth now |
| 5 Jun 2025 | £265,000 |
| 9 Feb 2024 | £217,000 |
70, Park View Terrace, Abercwmboi, Aberdare CF44 6AB
| Today | See what it's worth now |
| 2 Jun 2025 | £107,000 |
| 21 Apr 2017 | £34,000 |
No other historical records.
118, Y Dolydd, Cwmdare, Aberdare CF44 8EQ

| Today | See what it's worth now |
| 30 May 2025 | £253,000 |
| 6 Sep 2019 | £179,995 |
No other historical records.
4, Aman Street, Cwmaman, Aberdare CF44 6PD
| Today | See what it's worth now |
| 30 May 2025 | £80,000 |
No other historical records.
5, Belmont Terrace, Aberaman, Aberdare CF44 6UW
| Today | See what it's worth now |
| 30 May 2025 | £255,000 |
| 4 Nov 2022 | £189,999 |
66, Brecon Road, Aberdare CF44 9NL
| Today | See what it's worth now |
| 30 May 2025 | £81,000 |
| 9 Apr 2020 | £71,000 |
36, Llwyn Onn, Penderyn, Aberdare CF44 9YX
| Today | See what it's worth now |
| 28 May 2025 | £140,000 |
| 23 Mar 2001 | £32,000 |
13, Moriah Place, Llwydcoed, Aberdare CF44 0TS
| Today | See what it's worth now |
| 23 May 2025 | £170,000 |
| 7 Jul 2015 | £103,000 |
32, Glas-y-gors, Cwm-bach, Aberdare CF44 0BQ
| Today | See what it's worth now |
| 23 May 2025 | £315,000 |
| 30 May 2007 | £206,754 |
No other historical records.
1, Howells Row, Queen Street, Cwmdare, Aberdare CF44 8TU

| Today | See what it's worth now |
| 23 May 2025 | £130,000 |
No other historical records.
3, Woodland Park, Penderyn, Aberdare CF44 9TX
| Today | See what it's worth now |
| 23 May 2025 | £260,000 |
| 23 May 2016 | £160,000 |
No other historical records.
24, Gwawr Street, Aberaman, Aberdare CF44 6YP

| Today | See what it's worth now |
| 16 May 2025 | £165,000 |
| 12 Aug 2022 | £135,000 |
21, Rose Row, Cwm-bach, Aberdare CF44 0BN
| Today | See what it's worth now |
| 16 May 2025 | £145,000 |
No other historical records.
20, Pendarren Street, Aberdare CF44 7PE
| Today | See what it's worth now |
| 16 May 2025 | £185,000 |
| 17 Dec 2021 | £156,000 |
7, Miners Row, Llwydcoed, Aberdare CF44 0TP
| Today | See what it's worth now |
| 14 May 2025 | £70,000 |
| 23 Mar 1998 | £12,000 |
9, Heol Pendarren, Rhigos, Aberdare CF44 9PX
| Today | See what it's worth now |
| 9 May 2025 | £150,000 |
| 7 Oct 2013 | £68,000 |
No other historical records.
17, Bell Street, Trecynon, Aberdare CF44 8NW
| Today | See what it's worth now |
| 9 May 2025 | £104,995 |
| 30 Jun 2021 | £85,000 |
28, Rhodfa Crawshay, Cwmdare, Aberdare CF44 9BS
| Today | See what it's worth now |
| 8 May 2025 | £235,000 |
| 4 Jun 2021 | £164,995 |
No other historical records.
Find out how much your property is worth
The following agents can provide you with a free, no-obligation valuation. Simply select the ones you'd like to hear from.
Sponsored
All featured agents have paid a fee to promote their valuation expertise.

Peter Alan
Aberdare

Martin & Co
Merthyr Tydfil

Ramsay & White Estate Agents
Aberdare

Penhill Jones Property
Aberdare

Darlows
Merthyr Tydfil

T Samuel Estate Agents
Hirwaun
Get ready with a Mortgage in Principle
- Personalised result in just 20 minutes
- Find out how much you can borrow
- Get viewings faster with agents
- No impact on your credit score
What's your property worth?
House prices near CF44
Source Acknowledgement: © Crown copyright. England and Wales house price data is publicly available information produced by the HM Land Registry.This material was last updated on 6 August 2025. It covers the period from 1 January 1995 to 30 June 2025 and contains property transactions which have been registered during that period. Contains HM Land Registry data © Crown copyright and database right 2025. This data is licensed under the Open Government Licence v3.0.
Disclaimer: Rightmove.co.uk provides this HM Land Registry data "as is". The burden for fitness of the data relies completely with the user and is provided for informational purposes only. No warranty, express or implied, is given relating to the accuracy of content of the HM Land Registry data and Rightmove does not accept any liability for error or omission. If you have found an error with the data or need further information please contact HM Land Registry.
Permitted Use: Viewers of this Information are granted permission to access this Crown copyright material and to download it onto electronic, magnetic, optical or similar storage media provided that such activities are for private research, study or in-house use only. Any other use of the material requires the formal written permission of Land Registry which can be requested from us, and is subject to an additional licence and associated charge.
Map data ©OpenStreetMap contributors.
Rightmove takes no liability for your use of, or reliance on, Rightmove's Instant Valuation due to the limitations of our tracking tool listed here. Use of this tool is taken entirely at your own risk. All rights reserved.