
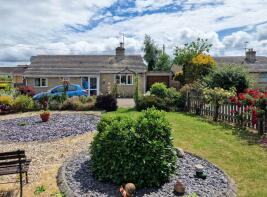
House Prices in Chalford
House prices in Chalford have an overall average of £383,152 over the last year.
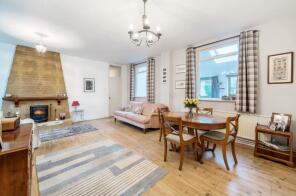
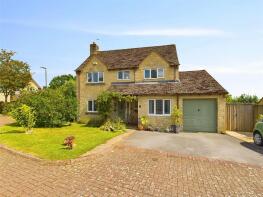
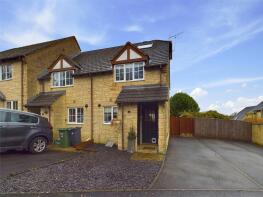
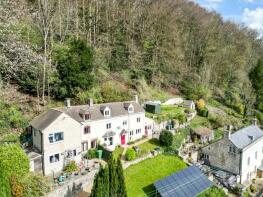
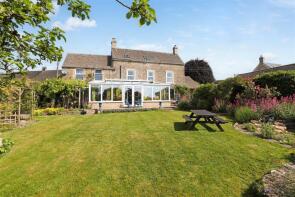
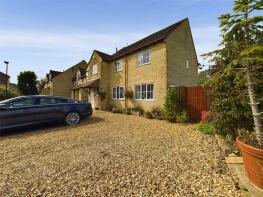
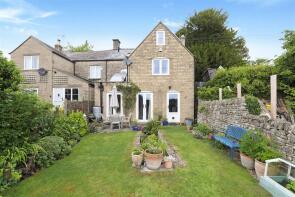
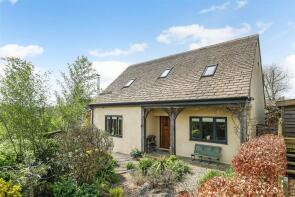
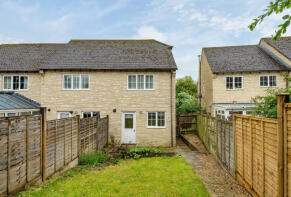
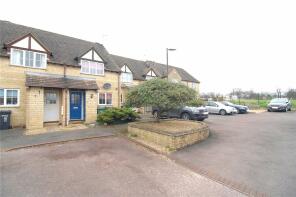
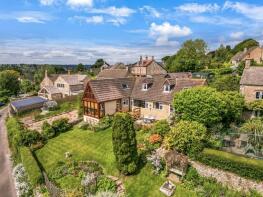
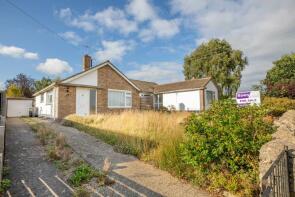
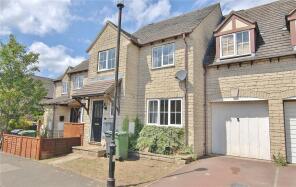
The majority of properties sold in Chalford during the last year were detached properties, selling for an average price of £534,305. Terraced properties sold for an average of £280,609, with semi-detached properties fetching £329,512.
Overall, the historical sold prices in Chalford over the last year were 3% down on the previous year and 1% down on the 2021 peak of £387,850.
Properties Sold
14, Lark Rise, Chalford, Stroud GL6 8FF


| Today | See what it's worth now |
| 2 Jun 2025 | £361,000 |
| 14 Sep 2015 | £200,000 |
2, Windermere, Chalford Hill, Stroud GL6 8BU
| Today | See what it's worth now |
| 23 May 2025 | £478,000 |
| 3 Feb 2003 | £205,000 |
No other historical records.
Hawthorn Bungalow, Cowcombe Lane, Stroud GL6 8HR
| Today | See what it's worth now |
| 1 Apr 2025 | £408,250 |
| 25 Jul 2002 | £176,000 |
No other historical records.
9, Robin Close, Chalford, Stroud GL6 8FN
| Today | See what it's worth now |
| 28 Mar 2025 | £560,000 |
| 27 Nov 2020 | £433,000 |
2, Eagle Close, Chalford, Stroud GL6 8FH
| Today | See what it's worth now |
| 28 Mar 2025 | £297,500 |
| 9 Sep 2022 | £282,500 |
2, Broadview, London Road, Chalford, Stroud GL6 8PU
| Today | See what it's worth now |
| 25 Mar 2025 | £450,000 |
| 8 Jun 2004 | £246,000 |
No other historical records.
Wyckhams, Abnash, Chalford Hill, Stroud GL6 8QW
| Today | See what it's worth now |
| 19 Mar 2025 | £930,000 |
| 12 Oct 2001 | £370,000 |
No other historical records.
10, Gardiner Close, Chalford, Stroud GL6 8NJ
| Today | See what it's worth now |
| 14 Mar 2025 | £400,000 |
| 1 Jun 1998 | £59,000 |
Little Cottage, Silver Street, Chalford Hill, Stroud GL6 8ES

| Today | See what it's worth now |
| 11 Mar 2025 | £285,000 |
| 7 Aug 2019 | £235,000 |
2, Hillside, Commercial Road, Chalford Hill, Stroud GL6 8QF
| Today | See what it's worth now |
| 27 Feb 2025 | £379,995 |
| 13 Dec 2013 | £320,000 |
The Imps, Coppice Hill, Chalford Hill, Stroud GL6 8LH
| Today | See what it's worth now |
| 27 Feb 2025 | £650,000 |
| 26 Jun 2015 | £255,000 |
Bluebell Cottage, High Street, Chalford, Stroud GL6 8DR

| Today | See what it's worth now |
| 7 Feb 2025 | £200,000 |
| 13 Sep 1995 | £56,000 |
No other historical records.
47, Eagle Close, Chalford, Stroud GL6 8FH
| Today | See what it's worth now |
| 5 Feb 2025 | £250,000 |
| 27 Jan 2000 | £61,427 |
No other historical records.
7, Gardiner Close, Chalford, Stroud GL6 8NJ
| Today | See what it's worth now |
| 20 Dec 2024 | £222,000 |
| 3 Oct 2014 | £145,000 |
Little Oaks, Coppice Hill, Chalford Hill, Stroud GL6 8LJ
| Today | See what it's worth now |
| 20 Dec 2024 | £592,000 |
No other historical records.
61, The Old Common, Chalford, Stroud GL6 8HH
| Today | See what it's worth now |
| 20 Dec 2024 | £260,000 |
| 18 Mar 2020 | £198,500 |
28, Tylers Way, Chalford Hill, Stroud GL6 8ND
| Today | See what it's worth now |
| 20 Dec 2024 | £355,000 |
No other historical records.
1, Bluebell Rise, Chalford, Stroud GL6 8NP
| Today | See what it's worth now |
| 18 Dec 2024 | £475,000 |
| 14 Jul 2017 | £300,000 |
No other historical records.
9, Down View, Chalford Hill, Stroud GL6 8NB
| Today | See what it's worth now |
| 17 Dec 2024 | £490,000 |
| 4 Aug 2020 | £236,000 |
70, The Old Common, Chalford, Stroud GL6 8JN
| Today | See what it's worth now |
| 13 Dec 2024 | £130,000 |
| 2 Feb 2015 | £90,000 |
80, The Old Common, Chalford, Stroud GL6 8JN
| Today | See what it's worth now |
| 12 Dec 2024 | £175,000 |
| 22 Jun 2001 | £60,000 |
14, Down View, Chalford Hill, Stroud GL6 8NB
| Today | See what it's worth now |
| 4 Dec 2024 | £475,000 |
| 8 Dec 2017 | £355,000 |
33, The Old Common, Chalford, Stroud GL6 8HH
| Today | See what it's worth now |
| 28 Nov 2024 | £250,000 |
| 1 Dec 2015 | £160,000 |
25, Burcombe Way, Chalford Hill, Stroud GL6 8NA
| Today | See what it's worth now |
| 22 Nov 2024 | £320,000 |
No other historical records.
65, The Old Common, Chalford, Stroud GL6 8HH
| Today | See what it's worth now |
| 18 Nov 2024 | £280,000 |
| 7 Apr 2006 | £165,500 |
Get ready with a Mortgage in Principle
- Personalised result in just 20 minutes
- Find out how much you can borrow
- Get viewings faster with agents
- No impact on your credit score
What's your property worth?
Source Acknowledgement: © Crown copyright. England and Wales house price data is publicly available information produced by the HM Land Registry.This material was last updated on 6 August 2025. It covers the period from 1 January 1995 to 30 June 2025 and contains property transactions which have been registered during that period. Contains HM Land Registry data © Crown copyright and database right 2025. This data is licensed under the Open Government Licence v3.0.
Disclaimer: Rightmove.co.uk provides this HM Land Registry data "as is". The burden for fitness of the data relies completely with the user and is provided for informational purposes only. No warranty, express or implied, is given relating to the accuracy of content of the HM Land Registry data and Rightmove does not accept any liability for error or omission. If you have found an error with the data or need further information please contact HM Land Registry.
Permitted Use: Viewers of this Information are granted permission to access this Crown copyright material and to download it onto electronic, magnetic, optical or similar storage media provided that such activities are for private research, study or in-house use only. Any other use of the material requires the formal written permission of Land Registry which can be requested from us, and is subject to an additional licence and associated charge.
Map data ©OpenStreetMap contributors.
Rightmove takes no liability for your use of, or reliance on, Rightmove's Instant Valuation due to the limitations of our tracking tool listed here. Use of this tool is taken entirely at your own risk. All rights reserved.