
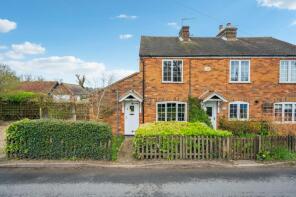
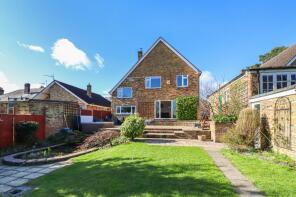
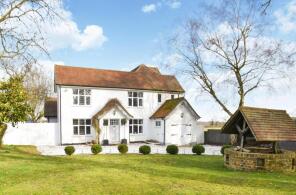
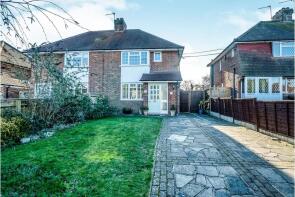
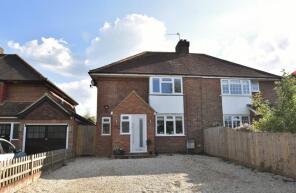
House Prices in Chartridge
House prices in Chartridge have an overall average of £1,059,167 over the last year.
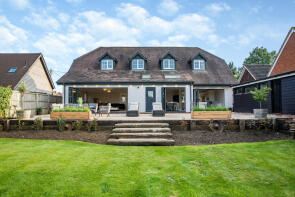
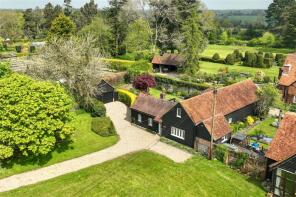
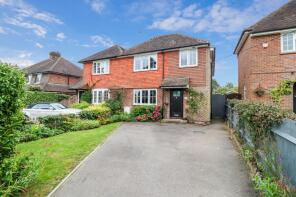
The majority of properties sold in Chartridge during the last year were semi-detached properties, selling for an average price of £757,500. Detached properties sold for an average of £1,662,500.
Overall, the historical sold prices in Chartridge over the last year were 6% up on the previous year and 2% down on the 2014 peak of £1,085,000.
Properties Sold
3, Chartridge Green Cottages, Chartridge Lane, Chesham HP5 2TL
| Today | See what it's worth now |
| 25 Mar 2025 | £430,000 |
| 30 May 1997 | £125,000 |
Elmcroft, Chartridge Lane, Chesham HP5 2TL
| Today | See what it's worth now |
| 19 Dec 2024 | £1,662,500 |
| 7 Nov 2019 | £960,000 |
Mapletree Cottage, Chartridge Lane, Chesham HP5 2TF
| Today | See what it's worth now |
| 17 Dec 2024 | £1,085,000 |
| 21 Mar 2014 | £665,000 |
422 Rose Trees, Chartridge Lane, Chesham HP5 2SJ
| Today | See what it's worth now |
| 26 Mar 2024 | £825,000 |
| 23 Nov 2018 | £620,000 |
409, Chartridge Lane, Chesham HP5 2SL
| Today | See what it's worth now |
| 3 Nov 2023 | £1,085,000 |
| 24 Oct 2014 | £740,000 |
Ridgewell End, Chartridge Grange Drive, Chesham HP5 2TG
| Today | See what it's worth now |
| 8 Sep 2023 | £1,075,000 |
| 4 Jul 2008 | £500,000 |
Ashott Cottage, Ashotts Lane, Chesham HP5 2TY
| Today | See what it's worth now |
| 24 May 2023 | £800,000 |
| 7 Oct 2020 | £800,000 |
399, Chartridge Lane, Chesham HP5 2SL
| Today | See what it's worth now |
| 1 Nov 2022 | £685,000 |
No other historical records.
2, Chapel Cottages, Chartridge Lane, Chesham HP5 2TJ
| Today | See what it's worth now |
| 26 Sep 2022 | £590,000 |
| 31 Mar 2016 | £320,000 |
No other historical records.
Mere, Chartridge Lane, Chesham HP5 2TF
| Today | See what it's worth now |
| 16 Sep 2022 | £617,500 |
| 1 Sep 1995 | £95,000 |
No other historical records.
Gamage Cottage, Chartridge Lane, Chesham HP5 2TQ
| Today | See what it's worth now |
| 17 Jun 2022 | £545,000 |
| 7 Jan 2016 | £499,000 |
Baroka, Chartridge Lane, Chesham HP5 2TZ
| Today | See what it's worth now |
| 7 Jun 2022 | £1,350,000 |
| 24 Sep 2004 | £674,000 |
The Spinney, Chartridge Grange Drive, Chesham HP5 2TG


| Today | See what it's worth now |
| 12 Nov 2021 | £1,500,000 |
No other historical records.
Tall Oaks, Chartridge Lane, Chesham HP5 2TZ
| Today | See what it's worth now |
| 25 Jun 2021 | £1,330,000 |
| 26 Sep 2012 | £825,000 |
Ashleigh, Chartridge Grange Drive, Chesham HP5 2TG

| Today | See what it's worth now |
| 28 May 2021 | £175,000 |
No other historical records.
411 Trelawney, Chartridge Lane, Chesham HP5 2SL
| Today | See what it's worth now |
| 17 Mar 2021 | £765,000 |
| 27 Aug 2015 | �£695,000 |
No other historical records.
421, Chartridge Lane, Chesham HP5 2SL
| Today | See what it's worth now |
| 11 Mar 2021 | £705,000 |
| 31 Jan 2017 | £656,000 |
No other historical records.
4, Chapel Cottages, Chartridge Lane, Chesham HP5 2TJ
| Today | See what it's worth now |
| 8 Jan 2021 | £687,500 |
| 23 Mar 2005 | £410,000 |
No other historical records.
5, Arnolds Cottages, Cogdells Lane, Chesham HP5 2TW
| Today | See what it's worth now |
| 28 Oct 2020 | £590,000 |
| 18 Aug 2009 | £275,000 |
384 Olvin, Chartridge Lane, Chesham HP5 2SJ
| Today | See what it's worth now |
| 11 Sep 2020 | £605,000 |
No other historical records.
12, Arnolds Cottages, Cogdells Lane, Chesham HP5 2TW
| Today | See what it's worth now |
| 28 Feb 2020 | £385,000 |
No other historical records.
Conifers, Chartridge Grange Drive, Chesham HP5 2TG
| Today | See what it's worth now |
| 24 Jan 2020 | £570,000 |
No other historical records.
394 Cayman Cottage, Chartridge Lane, Chesham HP5 2SJ
| Today | See what it's worth now |
| 30 Oct 2019 | £547,000 |
| 6 Sep 2013 | £348,000 |
No other historical records.
392 Pentire, Chartridge Lane, Chesham HP5 2SJ
| Today | See what it's worth now |
| 6 Sep 2019 | £625,000 |
| 10 Feb 2015 | £350,000 |
No other historical records.
401 Appletrees, Chartridge Lane, Chesham HP5 2SL
| Today | See what it's worth now |
| 2 Aug 2019 | £650,000 |
No other historical records.
Get ready with a Mortgage in Principle
- Personalised result in just 20 minutes
- Find out how much you can borrow
- Get viewings faster with agents
- No impact on your credit score
What's your property worth?
Source Acknowledgement: © Crown copyright. England and Wales house price data is publicly available information produced by the HM Land Registry.This material was last updated on 6 August 2025. It covers the period from 1 January 1995 to 30 June 2025 and contains property transactions which have been registered during that period. Contains HM Land Registry data © Crown copyright and database right 2025. This data is licensed under the Open Government Licence v3.0.
Disclaimer: Rightmove.co.uk provides this HM Land Registry data "as is". The burden for fitness of the data relies completely with the user and is provided for informational purposes only. No warranty, express or implied, is given relating to the accuracy of content of the HM Land Registry data and Rightmove does not accept any liability for error or omission. If you have found an error with the data or need further information please contact HM Land Registry.
Permitted Use: Viewers of this Information are granted permission to access this Crown copyright material and to download it onto electronic, magnetic, optical or similar storage media provided that such activities are for private research, study or in-house use only. Any other use of the material requires the formal written permission of Land Registry which can be requested from us, and is subject to an additional licence and associated charge.
Map data ©OpenStreetMap contributors.
Rightmove takes no liability for your use of, or reliance on, Rightmove's Instant Valuation due to the limitations of our tracking tool listed here. Use of this tool is taken entirely at your own risk. All rights reserved.