
House Prices in Coleford
House prices in Coleford have an overall average of £244,742 over the last year.
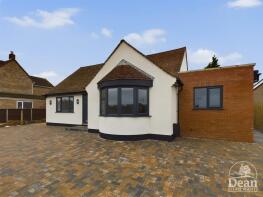
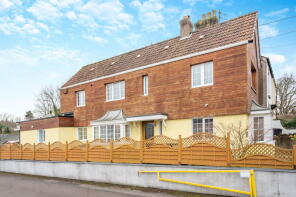
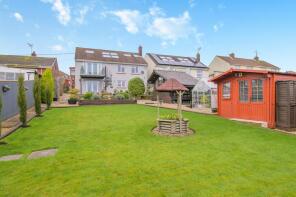
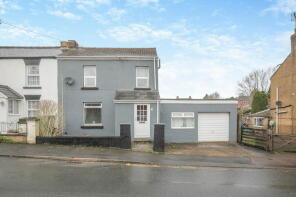
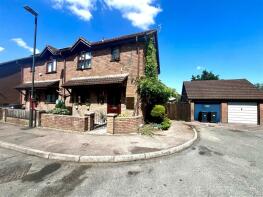
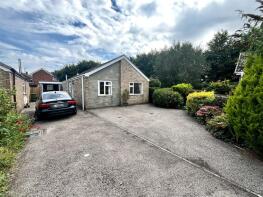
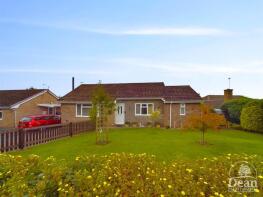
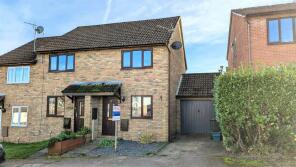
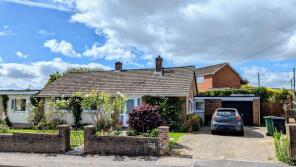
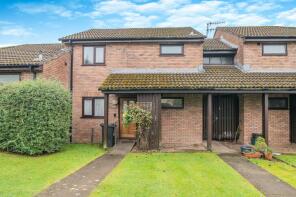
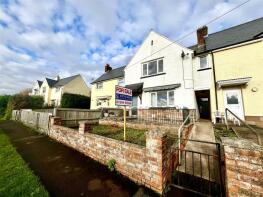
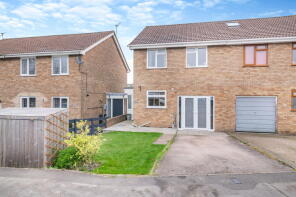
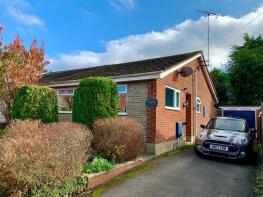
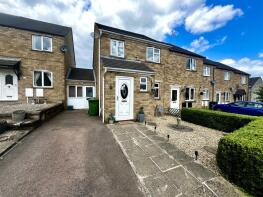
The majority of properties sold in Coleford during the last year were detached properties, selling for an average price of £334,657. Semi-detached properties sold for an average of £234,395, with terraced properties fetching £191,091.
Overall, the historical sold prices in Coleford over the last year were 6% down on the previous year and 3% down on the 2021 peak of £253,372.
Properties Sold
13, Orchard Road, Coleford GL16 8AU
| Today | See what it's worth now |
| 11 Jun 2025 | £400,000 |
| 20 Nov 2023 | £235,000 |
No other historical records.
30, The Links, Coleford GL16 8HX


| Today | See what it's worth now |
| 6 Jun 2025 | £225,000 |
| 30 Jun 2023 | £205,000 |
No other historical records.
13 Underleaf, Boxbush Road, Coleford GL16 8DN
| Today | See what it's worth now |
| 5 Jun 2025 | £295,000 |
| 19 May 2017 | £145,000 |
12, Orchard Road, Coleford GL16 8AU
| Today | See what it's worth now |
| 16 May 2025 | £380,000 |
| 4 Sep 2015 | £265,000 |
28, Victoria Road, Coleford GL16 8DR
| Today | See what it's worth now |
| 2 May 2025 | £240,500 |
| 9 Apr 1998 | £57,000 |
No other historical records.
16, Greenways Drive, Tufthorn, Coleford GL16 8PF
| Today | See what it's worth now |
| 17 Apr 2025 | £200,000 |
| 28 May 1999 | £50,000 |
43, The Links, Coleford GL16 8HX
| Today | See what it's worth now |
| 8 Apr 2025 | £271,000 |
| 22 Jul 2011 | £162,000 |
19, Mushet Place, Coleford GL16 8HS
| Today | See what it's worth now |
| 8 Apr 2025 | £390,000 |
| 17 Dec 2020 | £235,000 |
No other historical records.
75, Fairways Avenue, Coleford GL16 8RP
| Today | See what it's worth now |
| 3 Apr 2025 | £190,000 |
| 19 Feb 2021 | £167,500 |
20, Coombs Road, Coleford GL16 8AY
| Today | See what it's worth now |
| 28 Mar 2025 | £467,000 |
| 18 Sep 2020 | £362,000 |
12, Chapel Apartments, Bank Street, Coleford GL16 8BA
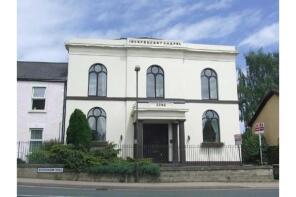
| Today | See what it's worth now |
| 26 Mar 2025 | £75,000 |
| 18 Feb 2011 | �£71,000 |
Springwinds, Ellwood Road, Coleford GL16 7LE

| Today | See what it's worth now |
| 24 Mar 2025 | £289,000 |
| 14 Dec 2017 | £228,000 |
No other historical records.
37, Lawdley Road, Coleford GL16 8SA

| Today | See what it's worth now |
| 21 Mar 2025 | £295,000 |
| 26 Jun 2015 | £185,000 |
3, Old Vicarage Court, Coleford GL16 8RR
| Today | See what it's worth now |
| 19 Mar 2025 | £98,000 |
| 8 Sep 2006 | £90,000 |
No other historical records.
49, Sunny Bank Road, Coleford GL16 8EH
| Today | See what it's worth now |
| 18 Mar 2025 | £180,000 |
| 26 Nov 2021 | £165,000 |
No other historical records.
14, Lawdley Road, Coleford GL16 8SB
| Today | See what it's worth now |
| 28 Feb 2025 | £215,000 |
| 22 Dec 2011 | £139,950 |
No other historical records.
37, Albert Road, Coleford GL16 8DY
| Today | See what it's worth now |
| 28 Feb 2025 | £235,000 |
| 6 Dec 2019 | £157,000 |
26, Pike Road, Coleford GL16 8DE
| Today | See what it's worth now |
| 27 Feb 2025 | £170,000 |
| 7 Oct 2021 | £125,000 |
2, Staunton Road, Coleford GL16 8DW

| Today | See what it's worth now |
| 21 Feb 2025 | £190,000 |
| 29 Oct 1996 | £51,000 |
No other historical records.
1, Astridge Close, Coleford GL16 8GA
| Today | See what it's worth now |
| 21 Feb 2025 | £305,000 |
| 18 Dec 2015 | £212,000 |
No other historical records.
28, The Links, Coleford GL16 8HX
| Today | See what it's worth now |
| 19 Feb 2025 | £260,000 |
| 20 Dec 2017 | £164,000 |
No other historical records.
11, Poolway Place, Coleford GL16 8DF
| Today | See what it's worth now |
| 14 Feb 2025 | £270,000 |
| 17 Aug 2007 | £161,000 |
17, Bessemer Close, Coleford GL16 8HH

| Today | See what it's worth now |
| 12 Feb 2025 | £300,000 |
| 3 Aug 2012 | £162,000 |
121, Fairways Avenue, Coleford GL16 8RP

| Today | See what it's worth now |
| 7 Feb 2025 | £89,000 |
| 12 Jan 2001 | £30,500 |
No other historical records.
15, Sylvan Close, Coleford GL16 8RU
| Today | See what it's worth now |
| 31 Jan 2025 | £255,000 |
| 31 May 2002 | £90,000 |
Get ready with a Mortgage in Principle
- Personalised result in just 20 minutes
- Find out how much you can borrow
- Get viewings faster with agents
- No impact on your credit score
What's your property worth?
Source Acknowledgement: © Crown copyright. England and Wales house price data is publicly available information produced by the HM Land Registry.This material was last updated on 6 August 2025. It covers the period from 1 January 1995 to 30 June 2025 and contains property transactions which have been registered during that period. Contains HM Land Registry data © Crown copyright and database right 2025. This data is licensed under the Open Government Licence v3.0.
Disclaimer: Rightmove.co.uk provides this HM Land Registry data "as is". The burden for fitness of the data relies completely with the user and is provided for informational purposes only. No warranty, express or implied, is given relating to the accuracy of content of the HM Land Registry data and Rightmove does not accept any liability for error or omission. If you have found an error with the data or need further information please contact HM Land Registry.
Permitted Use: Viewers of this Information are granted permission to access this Crown copyright material and to download it onto electronic, magnetic, optical or similar storage media provided that such activities are for private research, study or in-house use only. Any other use of the material requires the formal written permission of Land Registry which can be requested from us, and is subject to an additional licence and associated charge.
Map data ©OpenStreetMap contributors.
Rightmove takes no liability for your use of, or reliance on, Rightmove's Instant Valuation due to the limitations of our tracking tool listed here. Use of this tool is taken entirely at your own risk. All rights reserved.