
House Prices in DN19
House prices in DN19 have an overall average of £237,138 over the last year.
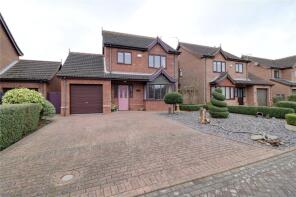
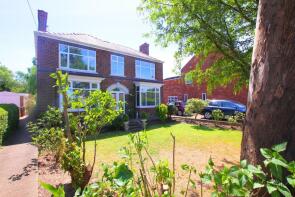
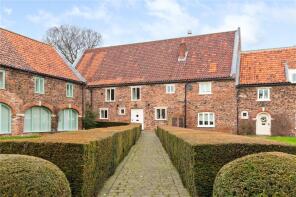
The majority of properties sold in DN19 during the last year were detached properties, selling for an average price of £291,970. Semi-detached properties sold for an average of £181,155, with terraced properties fetching £116,500.
Overall, the historical sold prices in DN19 over the last year were similar to the previous year and 6% down on the 2022 peak of £251,171.
Properties Sold
10, The Bridles, Barrow-upon-humber DN19 7GA
| Today | See what it's worth now |
| 10 Jun 2025 | £250,000 |
| 19 Jul 2002 | £81,950 |
No other historical records.
Fighel Dean, Wold Road, Barrow-upon-humber DN19 7BT
| Today | See what it's worth now |
| 3 Jun 2025 | £315,000 |
| 26 Mar 1997 | £60,000 |
No other historical records.
6, Westcote Farm, Barrow-upon-humber DN19 7DY
| Today | See what it's worth now |
| 23 May 2025 | £580,000 |
| 11 Jun 2021 | £520,000 |
6, Aspen Lane, Barrow Upon Humber DN19 7FG
| Today | See what it's worth now |
| 23 May 2025 | £360,000 |
| 2 Aug 2024 | £339,950 |
No other historical records.
Haven Lodge, West Hann Lane, Barrow Haven, Barrow-upon-humber DN19 7HD
| Today | See what it's worth now |
| 23 May 2025 | £605,000 |
| 10 Oct 2002 | £280,000 |
No other historical records.
Crossing Cottage, Gatehouse Road, Barrow-upon-humber DN19 7LS


| Today | See what it's worth now |
| 23 May 2025 | £125,000 |
| 22 Apr 2005 | £160,000 |
No other historical records.
4, Jasmine Court, Barrow-upon-humber DN19 7UD
| Today | See what it's worth now |
| 22 May 2025 | £195,000 |
| 28 Nov 2011 | £100,000 |
2, Forresters Hall, High Street, Barrow-upon-humber DN19 7AA
| Today | See what it's worth now |
| 16 Apr 2025 | £85,000 |
| 12 Sep 2008 | £140,000 |
No other historical records.
16, All Saints Close, Barrow-upon-humber DN19 7LL
| Today | See what it's worth now |
| 4 Apr 2025 | £183,000 |
| 3 May 2019 | £147,000 |
Acorn Cottage, North End, Barrow-upon-humber DN19 7JX
| Today | See what it's worth now |
| 31 Mar 2025 | £400,000 |
| 24 Mar 2016 | £270,000 |
Oakleigh, The Square, Barrow-upon-humber DN19 7JH

| Today | See what it's worth now |
| 28 Mar 2025 | £115,000 |
| 10 Dec 2015 | £107,000 |
4, Westcote Farm, Barrow-upon-humber DN19 7DY

| Today | See what it's worth now |
| 28 Mar 2025 | £440,000 |
| 24 Mar 2017 | £350,000 |
Baytree Court, Howe Lane, Barrow-upon-humber DN19 7JD
| Today | See what it's worth now |
| 27 Mar 2025 | £192,000 |
| 16 Apr 2014 | £192,500 |
Cor Cey, Green Lane, Barrow-upon-humber DN19 7BP

| Today | See what it's worth now |
| 27 Mar 2025 | £210,000 |
| 25 Aug 2022 | £188,000 |
No other historical records.
Foxholme, Peploe Lane, Barrow-upon-humber DN19 7PS
| Today | See what it's worth now |
| 24 Mar 2025 | £265,000 |
| 13 Apr 2023 | £260,000 |
3, Westburn Avenue, Barrow-upon-humber DN19 7SA
| Today | See what it's worth now |
| 21 Mar 2025 | £140,000 |
| 16 Dec 2002 | £68,000 |
6a, The Close, Barrow-upon-humber DN19 7LE
| Today | See what it's worth now |
| 20 Mar 2025 | £175,000 |
| 3 Nov 2011 | £124,500 |
16 Loft Cottage, Thornton Street, Barrow-upon-humber DN19 7DG
| Today | See what it's worth now |
| 5 Mar 2025 | £120,000 |
| 30 Apr 2004 | £67,500 |
24, Hallam Close, Barrow-upon-humber DN19 7FD
| Today | See what it's worth now |
| 4 Mar 2025 | £215,000 |
| 14 Aug 2009 | £156,700 |
No other historical records.
4, Harvest Rise, Barrow-upon-humber DN19 7SU
| Today | See what it's worth now |
| 28 Feb 2025 | £152,000 |
| 31 Jan 2023 | £154,500 |
35a, Palmer Lane, Barrow-upon-humber DN19 7BS
| Today | See what it's worth now |
| 25 Feb 2025 | £235,000 |
| 9 Sep 2011 | £140,000 |
No other historical records.
Dykeside Cottage, Goxhill Road, Barrow-upon-humber DN19 7EE
| Today | See what it's worth now |
| 20 Feb 2025 | £302,000 |
| 31 Oct 2002 | £163,000 |
25, Green Lane, Barrow-upon-humber DN19 7BP
| Today | See what it's worth now |
| 14 Feb 2025 | £240,000 |
| 16 Aug 2016 | £180,000 |
12, Hedgerow Close, Barrow-upon-humber DN19 7TE

| Today | See what it's worth now |
| 7 Feb 2025 | £184,000 |
| 20 Feb 2002 | £58,500 |
7 Hoblands, Rowan Close, Barrow-upon-humber DN19 7SL
| Today | See what it's worth now |
| 7 Feb 2025 | £155,000 |
| 25 Mar 2019 | £110,000 |
Find out how much your property is worth
The following agents can provide you with a free, no-obligation valuation. Simply select the ones you'd like to hear from.
Sponsored
All featured agents have paid a fee to promote their valuation expertise.

Paul Fox
Barton-Upon-Humber

DDM Residential
Barton

Lovelle
Barton Upon Humber

Beercocks
Barton
Get ready with a Mortgage in Principle
- Personalised result in just 20 minutes
- Find out how much you can borrow
- Get viewings faster with agents
- No impact on your credit score
What's your property worth?
Source Acknowledgement: © Crown copyright. England and Wales house price data is publicly available information produced by the HM Land Registry.This material was last updated on 6 August 2025. It covers the period from 1 January 1995 to 30 June 2025 and contains property transactions which have been registered during that period. Contains HM Land Registry data © Crown copyright and database right 2025. This data is licensed under the Open Government Licence v3.0.
Disclaimer: Rightmove.co.uk provides this HM Land Registry data "as is". The burden for fitness of the data relies completely with the user and is provided for informational purposes only. No warranty, express or implied, is given relating to the accuracy of content of the HM Land Registry data and Rightmove does not accept any liability for error or omission. If you have found an error with the data or need further information please contact HM Land Registry.
Permitted Use: Viewers of this Information are granted permission to access this Crown copyright material and to download it onto electronic, magnetic, optical or similar storage media provided that such activities are for private research, study or in-house use only. Any other use of the material requires the formal written permission of Land Registry which can be requested from us, and is subject to an additional licence and associated charge.
Data on planning applications, home extensions and build costs is provided by Resi.co.uk. Planning data is calculated using the last 2 years of residential applications within the selected planning authority. Home extension data, such as build costs and project timelines, are calculated using approximately 9,000 architectural projects Resi has completed, and 23,500 builders quotes submitted via Resi's platform. Build costs are adjusted according to inflation rates to more accurately represent today's prices.
Map data ©OpenStreetMap contributors.
Rightmove takes no liability for your use of, or reliance on, Rightmove's Instant Valuation due to the limitations of our tracking tool listed here. Use of this tool is taken entirely at your own risk. All rights reserved.