
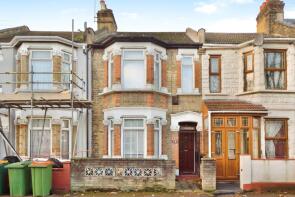
House Prices in East Ham
House prices in East Ham have an overall average of £421,744 over the last year.
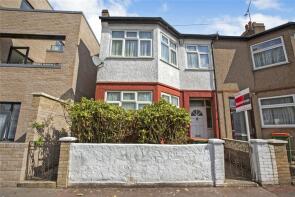
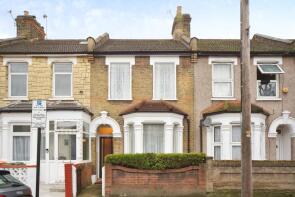
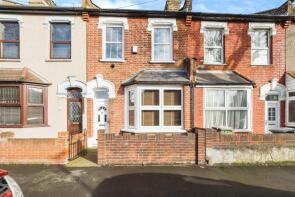
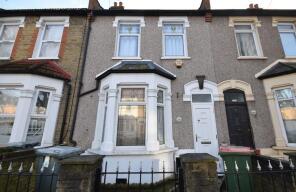
The majority of properties sold in East Ham during the last year were terraced properties, selling for an average price of £448,224. Flats sold for an average of £320,495, with semi-detached properties fetching £426,667.
Overall, the historical sold prices in East Ham over the last year were 2% up on the previous year and 16% down on the 2022 peak of £504,039.
Properties Sold
51, Sheridan Road, Manor Park, London E12 6QY


| Today | See what it's worth now |
| 19 Jun 2025 | £480,000 |
No other historical records.
86, Goldsmith Avenue, Manor Park, London E12 6QD

| Today | See what it's worth now |
| 17 Jun 2025 | £515,000 |
No other historical records.
202, South Esk Road, Forest Gate, London E7 8HD

| Today | See what it's worth now |
| 5 Jun 2025 | £500,000 |
| 9 Jul 2004 | £220,000 |
No other historical records.
1, White Horse Road, East Ham, London E6 6DR
| Today | See what it's worth now |
| 4 Jun 2025 | £450,000 |
No other historical records.
23, Altmore Avenue, East Ham, London E6 2BZ
| Today | See what it's worth now |
| 30 May 2025 | £390,000 |
No other historical records.
35, Gooseley Lane, East Ham, London E6 6AW
| Today | See what it's worth now |
| 30 May 2025 | £425,000 |
| 16 Aug 2002 | £125,000 |
No other historical records.
70, Frinton Road, East Ham, London E6 3HA
| Today | See what it's worth now |
| 28 May 2025 | £380,000 |
| 17 Dec 2002 | £155,000 |
No other historical records.
13, Mitcham Road, East Ham, London E6 3LT
| Today | See what it's worth now |
| 27 May 2025 | £435,000 |
| 23 Oct 2015 | £315,000 |
7, White Horse Road, East Ham, London E6 6DR

| Today | See what it's worth now |
| 27 May 2025 | £420,200 |
| 14 Apr 2021 | £350,000 |
47, Lawrence Road, East Ham, London E6 1JN
| Today | See what it's worth now |
| 23 May 2025 | £480,000 |
| 29 Apr 2016 | £390,000 |
No other historical records.
183a, Plashet Grove, East Ham, London E6 1BX
| Today | See what it's worth now |
| 23 May 2025 | £275,000 |
No other historical records.
73, Chesterford Road, Manor Park, London E12 6LD
| Today | See what it's worth now |
| 23 May 2025 | £465,000 |
| 27 Jan 1995 | £67,000 |
No other historical records.
131, Essex Road, Manor Park, London E12 6QR
| Today | See what it's worth now |
| 21 May 2025 | £465,000 |
No other historical records.
28, Skeffington Road, East Ham, London E6 2NB
| Today | See what it's worth now |
| 16 May 2025 | £170,000 |
| 24 Mar 2015 | £195,000 |
1, Altmore Avenue, East Ham, London E6 2BZ

| Today | See what it's worth now |
| 14 May 2025 | £460,000 |
No other historical records.
Flat 92, 1 Lyall House, Ironworks Way, East Ham, London E13 9FA

| Today | See what it's worth now |
| 12 May 2025 | £522,500 |
| 2 Nov 2018 | £480,995 |
No other historical records.
271, Central Park Road, East Ham, London E6 3AF
| Today | See what it's worth now |
| 9 May 2025 | £580,000 |
| 9 Aug 2006 | £245,000 |
No other historical records.
76, Keppel Road, East Ham, London E6 2BE
| Today | See what it's worth now |
| 9 May 2025 | £325,000 |
| 6 Nov 2013 | £210,000 |
1187, Newham Way, East Ham, London E6 5JJ
| Today | See what it's worth now |
| 9 May 2025 | £225,000 |
| 26 Oct 2017 | £250,000 |
No other historical records.
21, Grangewood Street, East Ham, London E6 1EZ
| Today | See what it's worth now |
| 30 Apr 2025 | £552,000 |
| 18 Dec 2014 | £305,000 |
136, Stokes Road, East Ham, London E6 3SE
| Today | See what it's worth now |
| 30 Apr 2025 | £400,000 |
No other historical records.
145a, Charlemont Road, East Ham, London E6 6HD
| Today | See what it's worth now |
| 18 Apr 2025 | £278,000 |
| 8 Feb 2019 | £264,000 |
52, Wellington Road, East Ham, London E6 2RG

| Today | See what it's worth now |
| 17 Apr 2025 | £250,000 |
| 29 Sep 1995 | £56,500 |
No other historical records.
58a, Boundary Road, Plaistow, London E13 9QG
| Today | See what it's worth now |
| 16 Apr 2025 | £318,000 |
No other historical records.
Flat 15, 2b Hertford Court, Vicarage Lane, East Ham, London E6 6BE
| Today | See what it's worth now |
| 11 Apr 2025 | £210,000 |
| 15 May 2015 | £165,000 |
Get ready with a Mortgage in Principle
- Personalised result in just 20 minutes
- Find out how much you can borrow
- Get viewings faster with agents
- No impact on your credit score
What's your property worth?
Source Acknowledgement: © Crown copyright. England and Wales house price data is publicly available information produced by the HM Land Registry.This material was last updated on 6 August 2025. It covers the period from 1 January 1995 to 30 June 2025 and contains property transactions which have been registered during that period. Contains HM Land Registry data © Crown copyright and database right 2025. This data is licensed under the Open Government Licence v3.0.
Disclaimer: Rightmove.co.uk provides this HM Land Registry data "as is". The burden for fitness of the data relies completely with the user and is provided for informational purposes only. No warranty, express or implied, is given relating to the accuracy of content of the HM Land Registry data and Rightmove does not accept any liability for error or omission. If you have found an error with the data or need further information please contact HM Land Registry.
Permitted Use: Viewers of this Information are granted permission to access this Crown copyright material and to download it onto electronic, magnetic, optical or similar storage media provided that such activities are for private research, study or in-house use only. Any other use of the material requires the formal written permission of Land Registry which can be requested from us, and is subject to an additional licence and associated charge.
Map data ©OpenStreetMap contributors.
Rightmove takes no liability for your use of, or reliance on, Rightmove's Instant Valuation due to the limitations of our tracking tool listed here. Use of this tool is taken entirely at your own risk. All rights reserved.