
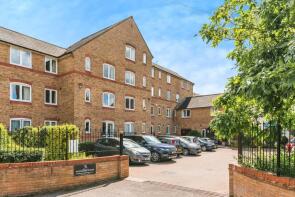
House Prices in Eynesbury
House prices in Eynesbury have an overall average of £293,714 over the last year.
The majority of properties sold in Eynesbury during the last year were semi-detached properties, selling for an average price of £316,053. Terraced properties sold for an average of £276,724, with detached properties fetching £403,976.
Overall, the historical sold prices in Eynesbury over the last year were 7% up on the previous year and 5% down on the 2022 peak of £309,722.
Properties Sold
99, Howitts Gardens, St. Neots PE19 2NS


| Today | See what it's worth now |
| 26 Jun 2025 | £240,000 |
| 6 Oct 2006 | £140,000 |
32, Manor Grove, St. Neots PE19 1PP
| Today | See what it's worth now |
| 20 Jun 2025 | £370,000 |
| 6 Mar 2020 | £326,000 |
21, Crocus Close, St. Neots PE19 2LP
| Today | See what it's worth now |
| 20 Jun 2025 | £310,000 |
| 4 Dec 2020 | £265,000 |
33, Cumberland Way, St. Neots PE19 2RQ
| Today | See what it's worth now |
| 19 Jun 2025 | £190,000 |
| 23 Sep 2019 | £155,000 |
54, Waterside Court, Church Street, St. Neots PE19 2BL
| Today | See what it's worth now |
| 13 Jun 2025 | £130,000 |
| 6 Oct 2023 | £125,000 |
28, Flint Way, St. Neots PE19 2RU

| Today | See what it's worth now |
| 6 Jun 2025 | £375,000 |
| 9 Nov 2018 | £280,000 |
21, Buttercup Avenue, St. Neots PE19 2LD
| Today | See what it's worth now |
| 30 May 2025 | £365,000 |
| 25 Nov 2021 | £325,000 |
3, Delphinium Court, St. Neots PE19 2LL

| Today | See what it's worth now |
| 30 May 2025 | £180,000 |
| 30 Nov 2017 | £172,500 |
15, Bevington Way, St. Neots PE19 2HQ
| Today | See what it's worth now |
| 30 May 2025 | £311,000 |
| 6 Sep 2022 | £308,000 |
93, Howitts Gardens, St. Neots PE19 2NS
| Today | See what it's worth now |
| 23 May 2025 | £240,500 |
| 8 Nov 2019 | £220,000 |
12, Fern Court, St. Neots PE19 2LN

| Today | See what it's worth now |
| 23 May 2025 | £76,400 |
| 19 Nov 2021 | £74,000 |
No other historical records.
10, Pope Road, Eynesbury PE19 2TG
| Today | See what it's worth now |
| 22 May 2025 | £425,000 |
No other historical records.
46, Waterside Court, Church Street, St. Neots PE19 2BL
| Today | See what it's worth now |
| 16 May 2025 | £98,000 |
| 30 Sep 2016 | £135,000 |
87, Andrew Road, St. Neots PE19 2PP

| Today | See what it's worth now |
| 30 Apr 2025 | £137,000 |
| 29 Aug 2007 | £115,000 |
6, Berkley Street, St. Neots PE19 2NB
| Today | See what it's worth now |
| 30 Apr 2025 | £405,500 |
| 31 Jan 1995 | £66,500 |
No other historical records.
49, Caldecote Road, St. Neots PE19 2UH
| Today | See what it's worth now |
| 29 Apr 2025 | £350,000 |
| 4 Dec 2015 | £233,000 |
62, Wren Walk, St. Neots PE19 2GE

| Today | See what it's worth now |
| 29 Apr 2025 | £380,000 |
| 6 Sep 2021 | £355,500 |
86, Potton Road, Eynesbury PE19 2NN
| Today | See what it's worth now |
| 11 Apr 2025 | £265,000 |
No other historical records.
45, Andrew Road, St. Neots PE19 2QE
| Today | See what it's worth now |
| 11 Apr 2025 | £306,000 |
| 11 Mar 2016 | £218,000 |
50, Lindisfarne Close, St. Neots PE19 2UU

| Today | See what it's worth now |
| 4 Apr 2025 | £150,000 |
| 28 Sep 2000 | £45,250 |
No other historical records.
35, Lindisfarne Close, St. Neots PE19 2UT

| Today | See what it's worth now |
| 28 Mar 2025 | £245,000 |
| 28 Apr 2023 | £220,000 |
18, Bevington Way, St. Neots PE19 2HQ

| Today | See what it's worth now |
| 28 Mar 2025 | £410,000 |
| 8 Dec 2003 | £204,950 |
No other historical records.
42, Bodiam Way, Eynesbury PE19 2RL
| Today | See what it's worth now |
| 28 Mar 2025 | £320,000 |
No other historical records.
6, Tenby Way, St. Neots PE19 2UR
| Today | See what it's worth now |
| 28 Mar 2025 | £370,000 |
| 7 Sep 2009 | £173,500 |
No other historical records.
2, Shortsands Yard, St. Neots PE19 1PQ

| Today | See what it's worth now |
| 28 Mar 2025 | £265,000 |
| 27 Jun 2022 | £255,000 |
Get ready with a Mortgage in Principle
- Personalised result in just 20 minutes
- Find out how much you can borrow
- Get viewings faster with agents
- No impact on your credit score
What's your property worth?
Source Acknowledgement: © Crown copyright. England and Wales house price data is publicly available information produced by the HM Land Registry.This material was last updated on 6 August 2025. It covers the period from 1 January 1995 to 30 June 2025 and contains property transactions which have been registered during that period. Contains HM Land Registry data © Crown copyright and database right 2025. This data is licensed under the Open Government Licence v3.0.
Disclaimer: Rightmove.co.uk provides this HM Land Registry data "as is". The burden for fitness of the data relies completely with the user and is provided for informational purposes only. No warranty, express or implied, is given relating to the accuracy of content of the HM Land Registry data and Rightmove does not accept any liability for error or omission. If you have found an error with the data or need further information please contact HM Land Registry.
Permitted Use: Viewers of this Information are granted permission to access this Crown copyright material and to download it onto electronic, magnetic, optical or similar storage media provided that such activities are for private research, study or in-house use only. Any other use of the material requires the formal written permission of Land Registry which can be requested from us, and is subject to an additional licence and associated charge.
Map data ©OpenStreetMap contributors.
Rightmove takes no liability for your use of, or reliance on, Rightmove's Instant Valuation due to the limitations of our tracking tool listed here. Use of this tool is taken entirely at your own risk. All rights reserved.