
House Prices in Eynsham
House prices in Eynsham have an overall average of £445,661 over the last year.
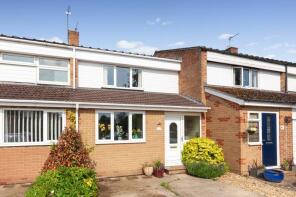
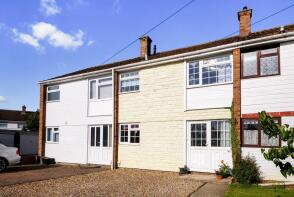
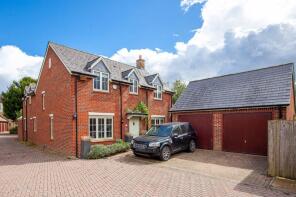
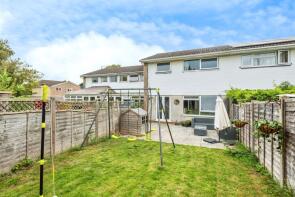
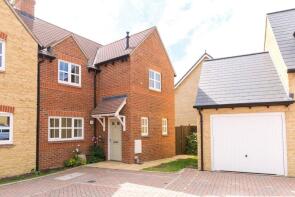
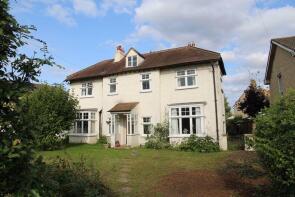
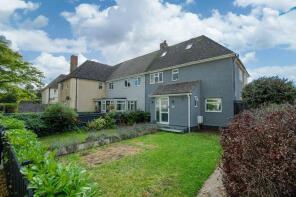
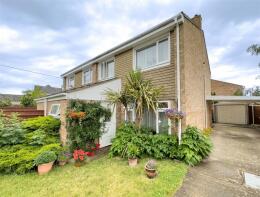
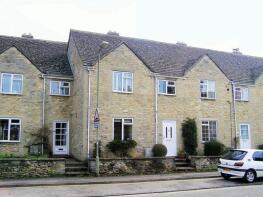
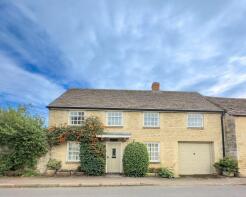
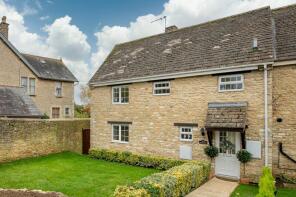
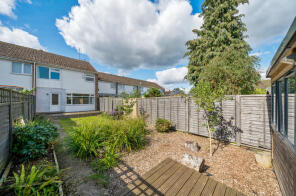
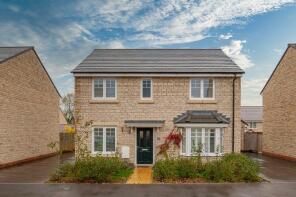
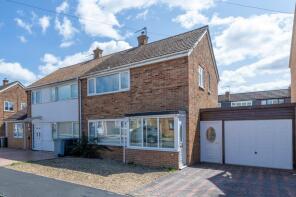
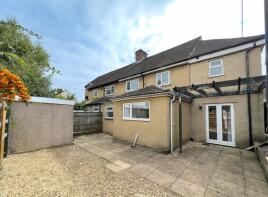
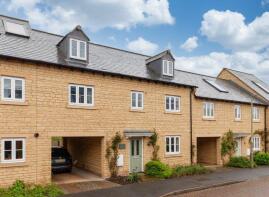
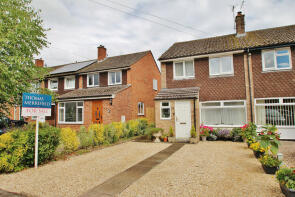
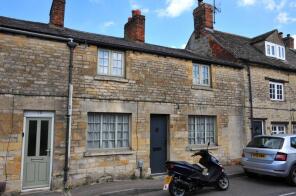
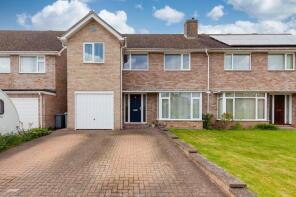
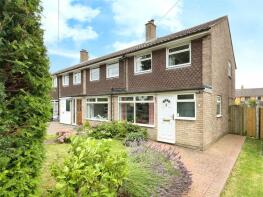
The majority of properties sold in Eynsham during the last year were semi-detached properties, selling for an average price of £415,583. Terraced properties sold for an average of £379,542, with detached properties fetching £675,000.
Overall, the historical sold prices in Eynsham over the last year were 8% down on the previous year and 8% down on the 2022 peak of £485,017.
Properties Sold
18, Beech Road, Witney OX29 4LJ
| Today | See what it's worth now |
| 11 Jun 2025 | £365,000 |
| 16 Apr 2010 | £205,000 |
8, Duncan Close, Witney OX29 4QH
| Today | See what it's worth now |
| 30 May 2025 | £316,000 |
| 6 Nov 2015 | £277,000 |
8, Abbey Farm Barns, Station Road, Witney OX29 4FA
| Today | See what it's worth now |
| 16 May 2025 | £625,000 |
| 14 Dec 2012 | £375,000 |
No other historical records.
2, Acre End Close, Witney OX29 4AB
| Today | See what it's worth now |
| 12 May 2025 | £680,000 |
| 30 Aug 2011 | £500,000 |
6, Hanborough Close, Witney OX29 4NR
| Today | See what it's worth now |
| 1 May 2025 | £300,000 |
| 12 Dec 2014 | £240,000 |
No other historical records.
4, Star Close, Witney OX29 4BF
| Today | See what it's worth now |
| 28 Mar 2025 | £363,500 |
| 7 Aug 2015 | £350,000 |
12, Swan Street, Witney OX29 4HU
| Today | See what it's worth now |
| 14 Mar 2025 | £224,000 |
| 6 Jul 2018 | £220,000 |
39, Falstaff Close, Witney OX29 4QA
| Today | See what it's worth now |
| 14 Mar 2025 | £430,000 |
| 26 Feb 2015 | £308,000 |
4, Witney Road, Witney OX29 4PG
| Today | See what it's worth now |
| 14 Feb 2025 | £890,000 |
| 24 Sep 2021 | £530,000 |
No other historical records.
5, Hanborough Road, Witney OX29 4LS
| Today | See what it's worth now |
| 4 Feb 2025 | £505,999 |
| 21 Jul 2003 | £179,950 |
No other historical records.
2, Wytham Close, Witney OX29 4NS
| Today | See what it's worth now |
| 28 Jan 2025 | £361,000 |
| 25 Oct 2006 | £223,000 |
No other historical records.
46, Mill Street, Witney OX29 4JU
| Today | See what it's worth now |
| 15 Jan 2025 | £440,000 |
| 17 Aug 2007 | £265,000 |
No other historical records.
Lords Cottage, Queen Street, Eynsham OX29 4HQ
| Today | See what it's worth now |
| 15 Jan 2025 | £585,000 |
No other historical records.
1, Merton Close, Witney OX29 4QE
| Today | See what it's worth now |
| 14 Jan 2025 | £450,000 |
| 15 Jan 2016 | £325,000 |
11, Duncan Close, Witney OX29 4QH
| Today | See what it's worth now |
| 20 Dec 2024 | £310,000 |
| 8 Feb 2008 | £200,000 |
No other historical records.
60, Saywell Crescent, Witney OX29 4FX
| Today | See what it's worth now |
| 19 Dec 2024 | £560,000 |
| 17 Feb 2021 | £517,750 |
No other historical records.
2, City Farm Barns, Eynsham OX29 4YA


| Today | See what it's worth now |
| 19 Dec 2024 | £650,000 |
No other historical records.
121, Spareacre Lane, Eynsham OX29 4NN
| Today | See what it's worth now |
| 19 Dec 2024 | £335,000 |
No other historical records.
35, Blakeman Lane, Eynsham OX29 4GD

| Today | See what it's worth now |
| 13 Dec 2024 | £205,000 |
No other historical records.
14, Spareacre Lane, Witney OX29 4NH
| Today | See what it's worth now |
| 13 Dec 2024 | £330,000 |
| 27 Aug 2004 | £200,000 |
18, Hazeldene Close, Witney OX29 4AD
| Today | See what it's worth now |
| 12 Dec 2024 | £650,000 |
| 27 Apr 2012 | £412,500 |
No other historical records.
53, Back Lane, Witney OX29 4QP
| Today | See what it's worth now |
| 11 Dec 2024 | £365,000 |
| 13 May 2016 | £280,000 |
8, Acre End Street, Witney OX29 4PA
| Today | See what it's worth now |
| 20 Nov 2024 | £385,000 |
| 16 May 2022 | £390,000 |
9, Queens Close, Witney OX29 4HN
| Today | See what it's worth now |
| 13 Nov 2024 | £610,000 |
| 9 Dec 1998 | £102,000 |
No other historical records.
39, Back Lane, Witney OX29 4QP
| Today | See what it's worth now |
| 8 Nov 2024 | £355,000 |
| 8 Apr 1999 | £89,950 |
No other historical records.
Get ready with a Mortgage in Principle
- Personalised result in just 20 minutes
- Find out how much you can borrow
- Get viewings faster with agents
- No impact on your credit score
What's your property worth?
Source Acknowledgement: © Crown copyright. England and Wales house price data is publicly available information produced by the HM Land Registry.This material was last updated on 6 August 2025. It covers the period from 1 January 1995 to 30 June 2025 and contains property transactions which have been registered during that period. Contains HM Land Registry data © Crown copyright and database right 2025. This data is licensed under the Open Government Licence v3.0.
Disclaimer: Rightmove.co.uk provides this HM Land Registry data "as is". The burden for fitness of the data relies completely with the user and is provided for informational purposes only. No warranty, express or implied, is given relating to the accuracy of content of the HM Land Registry data and Rightmove does not accept any liability for error or omission. If you have found an error with the data or need further information please contact HM Land Registry.
Permitted Use: Viewers of this Information are granted permission to access this Crown copyright material and to download it onto electronic, magnetic, optical or similar storage media provided that such activities are for private research, study or in-house use only. Any other use of the material requires the formal written permission of Land Registry which can be requested from us, and is subject to an additional licence and associated charge.
Map data ©OpenStreetMap contributors.
Rightmove takes no liability for your use of, or reliance on, Rightmove's Instant Valuation due to the limitations of our tracking tool listed here. Use of this tool is taken entirely at your own risk. All rights reserved.