
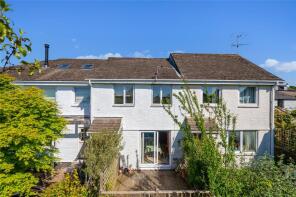
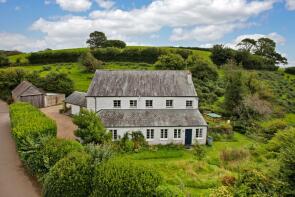
House Prices in Harberton
House prices in Harberton have an overall average of £557,000 over the last year.
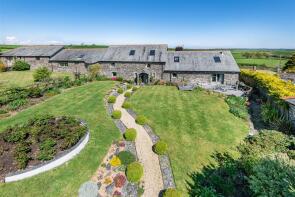
The majority of properties sold in Harberton during the last year were detached properties, selling for an average price of £637,500. Semi-detached properties sold for an average of £782,500, with terraced properties fetching £251,000.
Overall, the historical sold prices in Harberton over the last year were 41% up on the previous year and 16% down on the 2020 peak of £659,500.
Properties Sold
Hazard Hill View, Hazard Cottage To Hazard Farm, Totnes TQ9 7LN
| Today | See what it's worth now |
| 28 Mar 2025 | £660,000 |
| 25 Sep 2003 | £249,500 |
No other historical records.
Harberton House, The Square, Totnes TQ9 7SQ
| Today | See what it's worth now |
| 17 Mar 2025 | £615,000 |
| 20 Jul 2006 | £482,500 |
1, Town Farm, Totnes TQ9 7SN
| Today | See what it's worth now |
| 13 Mar 2025 | £515,000 |
| 26 Jul 2006 | £325,000 |
5, Old Hazard Cottages, Hazard Cottage To Hazard Farm, Totnes TQ9 7LN
| Today | See what it's worth now |
| 28 Feb 2025 | £267,000 |
| 10 Sep 2010 | £187,000 |
Moore Farm, Harberton TQ9 7LP


| Today | See what it's worth now |
| 19 Dec 2024 | £1,050,000 |
No other historical records.
8, Church Court, Totnes TQ9 7UG
| Today | See what it's worth now |
| 4 Nov 2024 | £235,000 |
| 28 Nov 2013 | £176,000 |
4, St Andrews Cottages, Leigh Bridge To Broadpark Stile, Totnes TQ9 7SL

| Today | See what it's worth now |
| 29 Aug 2024 | £272,500 |
| 7 Oct 2021 | £267,500 |
9, Old Hazard Cottages, Hazard Cottage To Hazard Farm, Totnes TQ9 7LN
| Today | See what it's worth now |
| 7 Aug 2024 | £275,000 |
| 16 Aug 2021 | £245,000 |
No other historical records.
Vine House, Road From Tristford Road To Globe House, Totnes TQ9 7SE
| Today | See what it's worth now |
| 12 Jul 2024 | £465,000 |
| 19 Feb 2021 | £475,000 |
The Steading, Tristford Barns, Leigh Bridge To Broadpark Stile, Totnes TQ9 7SP
| Today | See what it's worth now |
| 5 Jul 2024 | £570,000 |
| 29 Jan 2010 | £425,000 |
No other historical records.
The Old Forge, Leigh Bridge To Broadpark Stile, Totnes TQ9 7SJ
| Today | See what it's worth now |
| 30 Jun 2023 | £850,000 |
| 7 Dec 2000 | £310,000 |
No other historical records.
1, Victoria Cottages, Leigh Bridge To Broadpark Stile, Totnes TQ9 7SJ
| Today | See what it's worth now |
| 12 May 2023 | £610,000 |
| 19 Dec 2018 | £406,500 |
Myrtle Moore House, Bluepost To Hazard, Totnes TQ9 7LP

| Today | See what it's worth now |
| 6 Apr 2023 | £425,000 |
No other historical records.
Dundridge Grange, Lane Past Dundridge House, Totnes TQ9 7PL
| Today | See what it's worth now |
| 9 Nov 2022 | £590,000 |
| 23 Apr 2021 | £545,000 |
3, St Clements Terrace, Fore Street, Totnes TQ9 7SN
| Today | See what it's worth now |
| 27 Oct 2022 | £360,000 |
| 28 Jan 2005 | £188,500 |
New Oak Barn, West Leigh Farm, Harberton TQ9 7NE
| Today | See what it's worth now |
| 5 Oct 2022 | £795,000 |
| 3 Nov 2000 | £70,000 |
No other historical records.
Hillside Cottage, Road From Fore Street To Tristford Road, Totnes TQ9 7SE
| Today | See what it's worth now |
| 22 Sep 2022 | £650,000 |
| 5 Sep 2014 | £297,500 |
Pump Cottage, Old Hazard Cottages, Harberton TQ9 7LN
| Today | See what it's worth now |
| 11 Aug 2022 | £390,000 |
| 7 May 2021 | £297,000 |
10, Old Hazard Cottages, Hazard Cottage To Hazard Farm, Totnes TQ9 7LN
| Today | See what it's worth now |
| 20 Jul 2022 | £245,000 |
| 22 Aug 2011 | £170,000 |
No other historical records.
Fennels, Road From Fore Street To Tristford Road, Totnes TQ9 7SE
| Today | See what it's worth now |
| 5 Jul 2022 | £575,000 |
No other historical records.
1, St Clements Terrace, Fore Street, Totnes TQ9 7SN
| Today | See what it's worth now |
| 1 Mar 2022 | £340,000 |
| 7 Nov 2018 | £281,000 |
Stone Lodge, East Leigh Cross To Monkey Oak, Totnes TQ9 7SS

| Today | See what it's worth now |
| 28 Sep 2021 | £200,000 |
No other historical records.
Tristford Cottage, Tristford Road, Totnes TQ9 7SD
| Today | See what it's worth now |
| 2 Sep 2021 | £740,000 |
| 29 Feb 2008 | £270,000 |
7, Tristford Road, Totnes TQ9 7SD
| Today | See what it's worth now |
| 11 Aug 2021 | £305,000 |
| 8 Jan 2016 | £275,000 |
Higher Orchard, Tristford Road, Totnes TQ9 7SN
| Today | See what it's worth now |
| 3 Aug 2021 | £650,000 |
| 7 Jul 2006 | £450,000 |
No other historical records.
Get ready with a Mortgage in Principle
- Personalised result in just 20 minutes
- Find out how much you can borrow
- Get viewings faster with agents
- No impact on your credit score
What's your property worth?
Source Acknowledgement: © Crown copyright. England and Wales house price data is publicly available information produced by the HM Land Registry.This material was last updated on 6 August 2025. It covers the period from 1 January 1995 to 30 June 2025 and contains property transactions which have been registered during that period. Contains HM Land Registry data © Crown copyright and database right 2025. This data is licensed under the Open Government Licence v3.0.
Disclaimer: Rightmove.co.uk provides this HM Land Registry data "as is". The burden for fitness of the data relies completely with the user and is provided for informational purposes only. No warranty, express or implied, is given relating to the accuracy of content of the HM Land Registry data and Rightmove does not accept any liability for error or omission. If you have found an error with the data or need further information please contact HM Land Registry.
Permitted Use: Viewers of this Information are granted permission to access this Crown copyright material and to download it onto electronic, magnetic, optical or similar storage media provided that such activities are for private research, study or in-house use only. Any other use of the material requires the formal written permission of Land Registry which can be requested from us, and is subject to an additional licence and associated charge.
Map data ©OpenStreetMap contributors.
Rightmove takes no liability for your use of, or reliance on, Rightmove's Instant Valuation due to the limitations of our tracking tool listed here. Use of this tool is taken entirely at your own risk. All rights reserved.