
House Prices in Harlow
House prices in Harlow have an overall average of £348,185 over the last year.
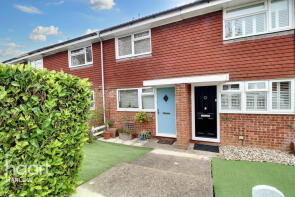
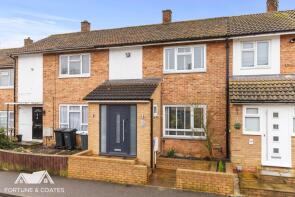
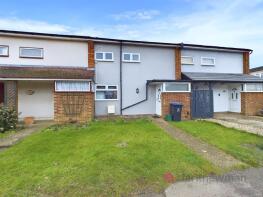
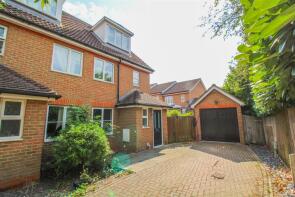
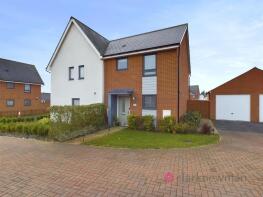
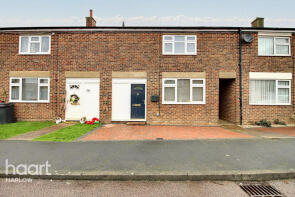
The majority of properties sold in Harlow during the last year were terraced properties, selling for an average price of £334,052. Flats sold for an average of £215,151, with semi-detached properties fetching £413,471.
Overall, the historical sold prices in Harlow over the last year were 3% up on the previous year and similar to the 2022 peak of £349,677.
Properties Sold
103, Bynghams, Harlow CM19 5NT
| Today | See what it's worth now |
| 20 Jun 2025 | £352,500 |
| 8 Apr 2016 | £270,000 |
93, Rushton Grove, Harlow CM17 9PS
| Today | See what it's worth now |
| 20 Jun 2025 | £318,000 |
| 25 Jun 2021 | £284,000 |
41, Rundells, Harlow CM18 7HB
| Today | See what it's worth now |
| 19 Jun 2025 | £372,000 |
No other historical records.
42, Barley Croft, Harlow CM18 7QZ
| Today | See what it's worth now |
| 19 Jun 2025 | £265,000 |
| 20 Jul 2015 | £170,000 |
No other historical records.
154, Churchfield, Harlow CM20 3DG
| Today | See what it's worth now |
| 17 Jun 2025 | £335,000 |
| 1 May 2019 | £269,000 |
13, The Fortunes, Harlow CM18 6PG
| Today | See what it's worth now |
| 17 Jun 2025 | £292,000 |
| 8 Oct 2020 | £245,000 |
267, Malkin Drive, Harlow CM17 9HQ
| Today | See what it's worth now |
| 16 Jun 2025 | £395,000 |
| 27 Jul 2012 | £245,000 |
4, Blackthorn Drive, Harlow CM17 0FS
| Today | See what it's worth now |
| 13 Jun 2025 | £442,500 |
| 29 Mar 2019 | £379,995 |
No other historical records.
3, Tendring Mews, Harlow CM18 6GB
| Today | See what it's worth now |
| 13 Jun 2025 | £345,000 |
| 23 Jun 2017 | £294,000 |
144, Blackbush Spring, Harlow CM20 3EB
| Today | See what it's worth now |
| 12 Jun 2025 | £351,000 |
| 29 Apr 2015 | £212,000 |
No other historical records.
83, Challinor, Harlow CM17 9XD
| Today | See what it's worth now |
| 12 Jun 2025 | £515,000 |
| 17 Feb 2004 | £250,000 |
5, Campions, Sheering Road, Sheering, Harlow CM17 0LJ

| Today | See what it's worth now |
| 11 Jun 2025 | £440,000 |
| 30 Nov 2012 | £251,975 |
No other historical records.
180, Little Brays, Harlow CM18 6EZ
| Today | See what it's worth now |
| 11 Jun 2025 | £300,000 |
| 30 Oct 2009 | £135,500 |
No other historical records.
139, Willowfield, Harlow CM18 6RX
| Today | See what it's worth now |
| 11 Jun 2025 | £325,000 |
No other historical records.
264, Long Banks, Harlow CM18 7PB
| Today | See what it's worth now |
| 9 Jun 2025 | £250,000 |
| 18 Feb 2005 | £132,000 |
Highfield, Moor Hall Road, Harlow CM17 0LP
| Today | See what it's worth now |
| 9 Jun 2025 | £875,000 |
| 27 Nov 2003 | £240,000 |
No other historical records.
23, Stile Croft, Harlow CM18 6LN


| Today | See what it's worth now |
| 6 Jun 2025 | £170,000 |
| 21 Oct 2011 | £67,500 |
71, Chiron Square, Harlow CM18 7FS
| Today | See what it's worth now |
| 5 Jun 2025 | £365,000 |
| 29 Sep 2019 | £340,000 |
No other historical records.
2, Carl House, Commonside Road, Harlow CM18 7SL
| Today | See what it's worth now |
| 5 Jun 2025 | £185,000 |
| 5 Feb 2021 | £168,500 |
13, Alexander Mews, Harlow CM17 9BX
| Today | See what it's worth now |
| 4 Jun 2025 | £365,000 |
| 6 Mar 2020 | £287,500 |
3, Roden Close, Harlow CM17 0LE
| Today | See what it's worth now |
| 4 Jun 2025 | £625,000 |
No other historical records.
19, Upper Park, Harlow CM20 1TN
| Today | See what it's worth now |
| 4 Jun 2025 | £477,000 |
| 3 Jul 2019 | £420,000 |
No other historical records.
18, Bird Cherry Lane, Harlow CM17 0FR
| Today | See what it's worth now |
| 2 Jun 2025 | £435,000 |
| 30 Jun 2020 | £390,000 |
No other historical records.
177, Bishopsfield, Harlow CM18 6UT

| Today | See what it's worth now |
| 2 Jun 2025 | £250,000 |
| 12 Nov 2010 | £141,000 |
229, Spencers Croft, Harlow CM18 6JN
| Today | See what it's worth now |
| 30 May 2025 | £270,000 |
| 8 Jan 2004 | £123,950 |
No other historical records.
Get ready with a Mortgage in Principle
- Personalised result in just 20 minutes
- Find out how much you can borrow
- Get viewings faster with agents
- No impact on your credit score
What's your property worth?
Source Acknowledgement: © Crown copyright. England and Wales house price data is publicly available information produced by the HM Land Registry.This material was last updated on 6 August 2025. It covers the period from 1 January 1995 to 30 June 2025 and contains property transactions which have been registered during that period. Contains HM Land Registry data © Crown copyright and database right 2025. This data is licensed under the Open Government Licence v3.0.
Disclaimer: Rightmove.co.uk provides this HM Land Registry data "as is". The burden for fitness of the data relies completely with the user and is provided for informational purposes only. No warranty, express or implied, is given relating to the accuracy of content of the HM Land Registry data and Rightmove does not accept any liability for error or omission. If you have found an error with the data or need further information please contact HM Land Registry.
Permitted Use: Viewers of this Information are granted permission to access this Crown copyright material and to download it onto electronic, magnetic, optical or similar storage media provided that such activities are for private research, study or in-house use only. Any other use of the material requires the formal written permission of Land Registry which can be requested from us, and is subject to an additional licence and associated charge.
Map data ©OpenStreetMap contributors.
Rightmove takes no liability for your use of, or reliance on, Rightmove's Instant Valuation due to the limitations of our tracking tool listed here. Use of this tool is taken entirely at your own risk. All rights reserved.