
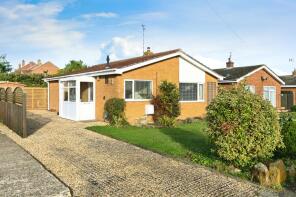
House Prices in Heacham
House prices in Heacham have an overall average of £328,816 over the last year.
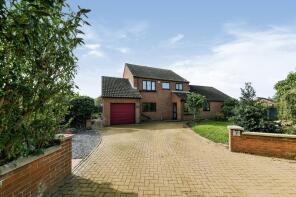
The majority of properties sold in Heacham during the last year were detached properties, selling for an average price of £402,000. Semi-detached properties sold for an average of £263,558, with terraced properties fetching £242,077.
Overall, the historical sold prices in Heacham over the last year were 6% up on the previous year and 6% down on the 2022 peak of £348,671.
Properties Sold
4, Jennings Close, King's Lynn PE31 7SU


| Today | See what it's worth now |
| 17 Jun 2025 | £172,000 |
| 7 Apr 2021 | £140,000 |
14, Robin Hill, Heacham PE31 7SS

| Today | See what it's worth now |
| 3 Jun 2025 | £429,500 |
No other historical records.
9, Marram Way, King's Lynn PE31 7AN
| Today | See what it's worth now |
| 29 May 2025 | £301,000 |
| 19 Dec 2000 | £43,000 |
21, Kenwood Road, King's Lynn PE31 7DD

| Today | See what it's worth now |
| 16 May 2025 | £215,000 |
| 24 Mar 2004 | £130,000 |
No other historical records.
4, Victoria Close, King's Lynn PE31 7JR
| Today | See what it's worth now |
| 14 May 2025 | £475,000 |
| 7 Jun 2019 | £345,000 |
No other historical records.
18, Gymkhana Way, King's Lynn PE31 7ST
| Today | See what it's worth now |
| 8 May 2025 | £320,000 |
| 7 Mar 2022 | £325,000 |
No other historical records.
18, Jubilee Road, King's Lynn PE31 7AS
| Today | See what it's worth now |
| 30 Apr 2025 | £545,000 |
| 5 Mar 2007 | £200,000 |
10, Strachan Close, Heacham PE31 7SB

| Today | See what it's worth now |
| 17 Apr 2025 | £245,000 |
No other historical records.
9, Ingleby Close, King's Lynn PE31 7SA
| Today | See what it's worth now |
| 28 Mar 2025 | £365,000 |
| 1 Feb 2017 | £320,000 |
4, Mulberry Place, King's Lynn PE31 7FD
| Today | See what it's worth now |
| 28 Mar 2025 | £367,000 |
| 27 Oct 2020 | £325,000 |
Holly Cottage, Ringstead Road, Heacham PE31 7HZ
| Today | See what it's worth now |
| 28 Mar 2025 | £237,500 |
No other historical records.
12, Pound Lane, King's Lynn PE31 7ET

| Today | See what it's worth now |
| 28 Mar 2025 | £280,000 |
| 31 Oct 2018 | £170,000 |
4, Pleasant Place, Pound Lane, King's Lynn PE31 7DS
| Today | See what it's worth now |
| 27 Mar 2025 | £170,000 |
| 28 Aug 2009 | £118,000 |
21, Caley Street, King's Lynn PE31 7DP
| Today | See what it's worth now |
| 26 Mar 2025 | £258,000 |
| 27 May 2015 | £145,000 |
16, Staithe Road, King's Lynn PE31 7ED
| Today | See what it's worth now |
| 7 Mar 2025 | £450,000 |
| 19 May 2017 | £255,000 |
28, Kenwood Road, King's Lynn PE31 7DD
| Today | See what it's worth now |
| 7 Mar 2025 | £415,000 |
| 1 Aug 2001 | £95,000 |
No other historical records.
23, Linn Chilvers Drive, King's Lynn PE31 7SW
| Today | See what it's worth now |
| 7 Mar 2025 | £227,500 |
| 25 Jul 2014 | £144,000 |
No other historical records.
21, Folgate Road, King's Lynn PE31 7BQ
| Today | See what it's worth now |
| 28 Feb 2025 | £268,000 |
| 2 Oct 2017 | £198,000 |
No other historical records.
6, Hitch Close, King's Lynn PE31 7JD
| Today | See what it's worth now |
| 20 Feb 2025 | £350,000 |
| 14 Apr 2021 | £320,000 |
43, Meadow Road, King's Lynn PE31 7DY
| Today | See what it's worth now |
| 14 Feb 2025 | £275,000 |
| 28 Mar 2022 | £290,000 |
No other historical records.
5, Cross Way, King's Lynn PE31 7TB
| Today | See what it's worth now |
| 11 Feb 2025 | £305,000 |
| 5 Aug 2016 | £222,500 |
34, Church Lane, King's Lynn PE31 7HJ
| Today | See what it's worth now |
| 11 Feb 2025 | £565,000 |
| 30 May 2013 | £165,000 |
No other historical records.
6, Sea Close, King's Lynn PE31 7AX
| Today | See what it's worth now |
| 7 Feb 2025 | £375,000 |
| 22 Aug 2013 | £120,000 |
No other historical records.
13, Collingwood Close, King's Lynn PE31 7LD
| Today | See what it's worth now |
| 23 Jan 2025 | £280,000 |
| 28 Feb 2017 | £205,000 |
10a, Meadow Road, King's Lynn PE31 7DY
| Today | See what it's worth now |
| 10 Jan 2025 | £268,000 |
| 6 Jun 1997 | £45,000 |
No other historical records.
Get ready with a Mortgage in Principle
- Personalised result in just 20 minutes
- Find out how much you can borrow
- Get viewings faster with agents
- No impact on your credit score
What's your property worth?
Source Acknowledgement: © Crown copyright. England and Wales house price data is publicly available information produced by the HM Land Registry.This material was last updated on 6 August 2025. It covers the period from 1 January 1995 to 30 June 2025 and contains property transactions which have been registered during that period. Contains HM Land Registry data © Crown copyright and database right 2025. This data is licensed under the Open Government Licence v3.0.
Disclaimer: Rightmove.co.uk provides this HM Land Registry data "as is". The burden for fitness of the data relies completely with the user and is provided for informational purposes only. No warranty, express or implied, is given relating to the accuracy of content of the HM Land Registry data and Rightmove does not accept any liability for error or omission. If you have found an error with the data or need further information please contact HM Land Registry.
Permitted Use: Viewers of this Information are granted permission to access this Crown copyright material and to download it onto electronic, magnetic, optical or similar storage media provided that such activities are for private research, study or in-house use only. Any other use of the material requires the formal written permission of Land Registry which can be requested from us, and is subject to an additional licence and associated charge.
Map data ©OpenStreetMap contributors.
Rightmove takes no liability for your use of, or reliance on, Rightmove's Instant Valuation due to the limitations of our tracking tool listed here. Use of this tool is taken entirely at your own risk. All rights reserved.