
House Prices in Helperby
House prices in Helperby have an overall average of £432,444 over the last year.
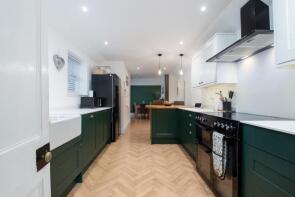
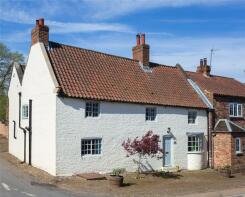
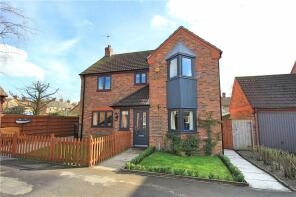
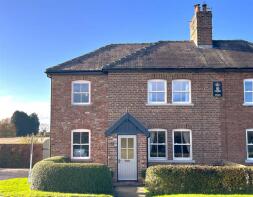
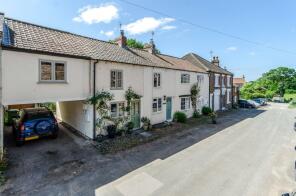
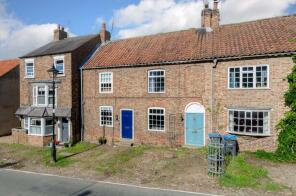
The majority of properties sold in Helperby during the last year were terraced properties, selling for an average price of £352,000. Semi-detached properties sold for an average of £461,000, with detached properties fetching £550,500.
Overall, the historical sold prices in Helperby over the last year were 14% up on the previous year and 3% down on the 2022 peak of £447,654.
Properties Sold
Valley House, Main Street, York YO61 2PS
| Today | See what it's worth now |
| 10 Mar 2025 | £316,000 |
| 10 Jun 2016 | £218,000 |
Fishermans House, Main Street, York YO61 2NT
| Today | See what it's worth now |
| 16 Dec 2024 | £610,000 |
| 13 Dec 2017 | £390,000 |
Brafferton Hall West, Road To Laurel Farm, York YO61 2NZ
| Today | See what it's worth now |
| 16 Dec 2024 | £748,000 |
| 14 Dec 2005 | £463,000 |
No other historical records.
The Cottage, Main Street, York YO61 2PS
| Today | See what it's worth now |
| 29 Nov 2024 | £267,000 |
| 20 Nov 2020 | £197,500 |
Half Moon House, Main Street, Helperby YO61 2PS
| Today | See what it's worth now |
| 28 Nov 2024 | £636,000 |
| 6 Oct 2020 | £570,000 |
8, Dunroyal Close, York YO61 2NH
| Today | See what it's worth now |
| 27 Sep 2024 | £465,000 |
| 10 Jul 2015 | £317,500 |
1, Thornton Manor Cottages, Burton Cottages To Thornton Manor, York YO61 2RH
| Today | See what it's worth now |
| 13 Sep 2024 | £392,500 |
| 31 Mar 2014 | £175,000 |
No other historical records.
Rose Cottage, Bridge Street, York YO61 2NU
| Today | See what it's worth now |
| 30 Aug 2024 | £215,000 |
| 25 Mar 2021 | £184,800 |
South Cottage, Main Street, York YO61 2PW
| Today | See what it's worth now |
| 27 Aug 2024 | £242,500 |
| 25 May 2001 | £84,950 |
Coates House, Townend Way, Brafferton YO61 2QW


| Today | See what it's worth now |
| 29 Jul 2024 | £600,000 |
No other historical records.
4, Broad Ford Drive, Brafferton YO61 2AB

| Today | See what it's worth now |
| 17 Jul 2024 | £450,000 |
No other historical records.
The Old Coaching House, Drury Lane, York YO61 2PJ
| Today | See what it's worth now |
| 9 Jul 2024 | £285,000 |
| 4 Oct 2017 | £235,000 |
Cobblers Cottage, Main Street, York YO61 2PW
| Today | See what it's worth now |
| 31 May 2024 | £325,000 |
| 1 Jul 2016 | £235,000 |
Rye House, Craven Court, Helperby YO61 2AA

| Today | See what it's worth now |
| 5 Apr 2024 | £881,000 |
No other historical records.
Woodland Cottage, Main Street, York YO61 2NS
| Today | See what it's worth now |
| 28 Mar 2024 | £325,000 |
| 6 Dec 2013 | £235,000 |
Jameson House, Main Street, York YO61 2PW
| Today | See what it's worth now |
| 22 Feb 2024 | £292,500 |
No other historical records.
Humberton Grange, Sandy Lane, Helperby, Humberton YO61 2RX

| Today | See what it's worth now |
| 21 Dec 2023 | £474,091 |
No other historical records.
1, Crown Cottages, Sandy Lane, Humberton YO61 2RX

| Today | See what it's worth now |
| 21 Dec 2023 | �£221,242 |
No other historical records.
Chestnut View, Raskelf Road, York YO61 2PF
| Today | See what it's worth now |
| 15 Dec 2023 | £125,000 |
No other historical records.
2, Chestnut Row, Raskelf Road, York YO61 2PE
| Today | See what it's worth now |
| 22 Nov 2023 | £180,000 |
No other historical records.
The Old Shop, Main Street, York YO61 2PW
| Today | See what it's worth now |
| 12 Jan 2023 | £490,000 |
| 10 Dec 2009 | £375,000 |
The Grange, The Maltings, York YO61 2NQ
| Today | See what it's worth now |
| 30 Nov 2022 | £1,350,000 |
No other historical records.
Green Vale, Back Lane, York YO61 2PL
| Today | See what it's worth now |
| 25 Nov 2022 | £222,500 |
| 19 Apr 2013 | £168,500 |
No other historical records.
12, Manor Drive, York YO61 2QA
| Today | See what it's worth now |
| 4 Nov 2022 | £272,000 |
| 8 Feb 2018 | £228,000 |
No other historical records.
1, Dunroyal, York YO61 2PY

| Today | See what it's worth now |
| 21 Oct 2022 | £270,000 |
No other historical records.
Get ready with a Mortgage in Principle
- Personalised result in just 20 minutes
- Find out how much you can borrow
- Get viewings faster with agents
- No impact on your credit score
What's your property worth?
Source Acknowledgement: © Crown copyright. England and Wales house price data is publicly available information produced by the HM Land Registry.This material was last updated on 6 August 2025. It covers the period from 1 January 1995 to 30 June 2025 and contains property transactions which have been registered during that period. Contains HM Land Registry data © Crown copyright and database right 2025. This data is licensed under the Open Government Licence v3.0.
Disclaimer: Rightmove.co.uk provides this HM Land Registry data "as is". The burden for fitness of the data relies completely with the user and is provided for informational purposes only. No warranty, express or implied, is given relating to the accuracy of content of the HM Land Registry data and Rightmove does not accept any liability for error or omission. If you have found an error with the data or need further information please contact HM Land Registry.
Permitted Use: Viewers of this Information are granted permission to access this Crown copyright material and to download it onto electronic, magnetic, optical or similar storage media provided that such activities are for private research, study or in-house use only. Any other use of the material requires the formal written permission of Land Registry which can be requested from us, and is subject to an additional licence and associated charge.
Map data ©OpenStreetMap contributors.
Rightmove takes no liability for your use of, or reliance on, Rightmove's Instant Valuation due to the limitations of our tracking tool listed here. Use of this tool is taken entirely at your own risk. All rights reserved.