
House Prices in LE65
House prices in LE65 have an overall average of £346,476 over the last year.
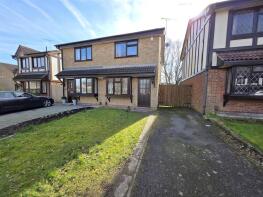
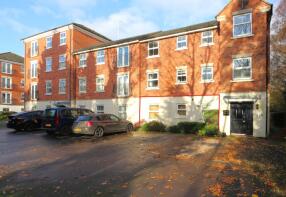
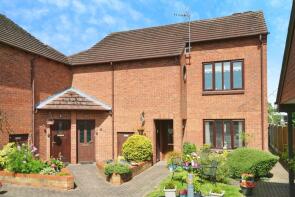
The majority of properties sold in LE65 during the last year were detached properties, selling for an average price of £437,292. Semi-detached properties sold for an average of £264,234, with terraced properties fetching £251,261.
Overall, the historical sold prices in LE65 over the last year were similar to the previous year and similar to the 2022 peak of £348,994.
Properties Sold
17, Woodside, Ashby-de-la-zouch LE65 2NJ
| Today | See what it's worth now |
| 20 Jun 2025 | £207,000 |
| 16 Jan 1998 | £54,000 |
No other historical records.
27, Hopkins Grove, Ashby De La Zouch LE65 2BB
| Today | See what it's worth now |
| 13 Jun 2025 | £112,000 |
No other historical records.
20, Dickinson Close, Ashby-de-la-zouch LE65 2WD
| Today | See what it's worth now |
| 6 Jun 2025 | £585,000 |
| 26 Mar 2021 | £540,000 |
No other historical records.
32, Trinity Close, Ashby De La Zouch LE65 2GS
| Today | See what it's worth now |
| 6 Jun 2025 | £342,000 |
No other historical records.
46, Rouen Way, Ashby-de-la-zouch LE65 2QX
| Today | See what it's worth now |
| 30 May 2025 | £280,000 |
| 4 May 2001 | £60,000 |
No other historical records.
Kauri Cottage, Park Road, Ashby-de-la-zouch LE65 1JB
| Today | See what it's worth now |
| 29 May 2025 | £270,000 |
| 31 Oct 2023 | £166,500 |
1, Ash Drive, Ashby-de-la-zouch LE65 2JX
| Today | See what it's worth now |
| 23 May 2025 | £200,000 |
| 17 Dec 2010 | £130,000 |
No other historical records.
26, Rydal Gardens, Ashby-de-la-zouch LE65 1FJ
| Today | See what it's worth now |
| 21 May 2025 | £460,000 |
| 1 Aug 2014 | £325,000 |
25, Dickinson Close, Ashby-de-la-zouch LE65 2WD
| Today | See what it's worth now |
| 20 May 2025 | £425,000 |
| 11 Dec 2020 | £362,000 |
No other historical records.
48, Highfields Close, Ashby-de-la-zouch LE65 2FN
| Today | See what it's worth now |
| 20 May 2025 | £345,000 |
| 24 Nov 2021 | £325,000 |
No other historical records.
30, Tudor Close, Ashby-de-la-zouch LE65 1TZ
| Today | See what it's worth now |
| 16 May 2025 | £195,000 |
| 21 May 2020 | £162,000 |
11, Cedar Close, Ashby-de-la-zouch LE65 1SQ
| Today | See what it's worth now |
| 16 May 2025 | £187,500 |
| 6 Mar 2015 | £125,000 |
63, Astley Way, Ashby-de-la-zouch LE65 1LY
| Today | See what it's worth now |
| 16 May 2025 | £132,000 |
| 10 Nov 2006 | £127,703 |
No other historical records.
Church Barn, Chapel Street, Smisby, Ashby De La Zouch LE65 2TJ
| Today | See what it's worth now |
| 15 May 2025 | £525,000 |
No other historical records.
16, Western Close, Ashby De La Zouch LE65 2FB
| Today | See what it's worth now |
| 9 May 2025 | £25,000 |
No other historical records.
9, Cotswold Way, Ashby De La Zouch LE65 1ET
| Today | See what it's worth now |
| 9 May 2025 | £407,000 |
No other historical records.
20, Royal Mews, Station Road, Ashby-de-la-zouch LE65 2GJ
| Today | See what it's worth now |
| 8 May 2025 | £133,000 |
| 20 Sep 2013 | £102,000 |
4, Pointon Lane, Ashby-de-la-zouch LE65 2RS
| Today | See what it's worth now |
| 2 May 2025 | £345,000 |
| 27 Apr 2018 | £299,995 |
No other historical records.
52, Woodside, Ashby De La Zouch LE65 2NL
| Today | See what it's worth now |
| 25 Apr 2025 | £245,000 |
No other historical records.
12, Glade Lane, Ashby-de-la-zouch LE65 2RP
| Today | See what it's worth now |
| 24 Apr 2025 | £315,000 |
| 14 Dec 2018 | £264,995 |
No other historical records.
4, Wrekin Close, Ashby De La Zouch LE65 1EX
| Today | See what it's worth now |
| 24 Apr 2025 | £422,000 |
No other historical records.
8, Royal Mews, Station Road, Ashby-de-la-zouch LE65 2GJ
| Today | See what it's worth now |
| 17 Apr 2025 | £185,000 |
| 25 Nov 2020 | £175,000 |
6, Lower Packington Road, Ashby-de-la-zouch LE65 1GD
| Today | See what it's worth now |
| 17 Apr 2025 | £290,000 |
| 25 Oct 2010 | £161,000 |
2, Hungerford Close, Ashby-de-la-zouch LE65 1FT
| Today | See what it's worth now |
| 15 Apr 2025 | £345,000 |
| 25 Sep 2015 | £232,500 |
15, Huntingdon Road, Ashby-de-la-zouch LE65 2NH
| Today | See what it's worth now |
| 11 Apr 2025 | £245,000 |
| 28 Oct 2016 | £184,000 |
No other historical records.
Find out how much your property is worth
The following agents can provide you with a free, no-obligation valuation. Simply select the ones you'd like to hear from.
Sponsored
All featured agents have paid a fee to promote their valuation expertise.

Frank Innes
Ashby De-La Zouch

Newton Fallowell
Ashby-De-La-Zouch

Alexanders
Ashby-De-La-Zouch

Royston & Lund Estate Agents
Ashby De La Zouch

Howkins & Harrison
Ashby-De-La-Zouch

John German
Ashby de la Zouch
Get ready with a Mortgage in Principle
- Personalised result in just 20 minutes
- Find out how much you can borrow
- Get viewings faster with agents
- No impact on your credit score
What's your property worth?
Source Acknowledgement: © Crown copyright. England and Wales house price data is publicly available information produced by the HM Land Registry.This material was last updated on 6 August 2025. It covers the period from 1 January 1995 to 30 June 2025 and contains property transactions which have been registered during that period. Contains HM Land Registry data © Crown copyright and database right 2025. This data is licensed under the Open Government Licence v3.0.
Disclaimer: Rightmove.co.uk provides this HM Land Registry data "as is". The burden for fitness of the data relies completely with the user and is provided for informational purposes only. No warranty, express or implied, is given relating to the accuracy of content of the HM Land Registry data and Rightmove does not accept any liability for error or omission. If you have found an error with the data or need further information please contact HM Land Registry.
Permitted Use: Viewers of this Information are granted permission to access this Crown copyright material and to download it onto electronic, magnetic, optical or similar storage media provided that such activities are for private research, study or in-house use only. Any other use of the material requires the formal written permission of Land Registry which can be requested from us, and is subject to an additional licence and associated charge.
Data on planning applications, home extensions and build costs is provided by Resi.co.uk. Planning data is calculated using the last 2 years of residential applications within the selected planning authority. Home extension data, such as build costs and project timelines, are calculated using approximately 9,000 architectural projects Resi has completed, and 23,500 builders quotes submitted via Resi's platform. Build costs are adjusted according to inflation rates to more accurately represent today's prices.
Map data ©OpenStreetMap contributors.
Rightmove takes no liability for your use of, or reliance on, Rightmove's Instant Valuation due to the limitations of our tracking tool listed here. Use of this tool is taken entirely at your own risk. All rights reserved.