
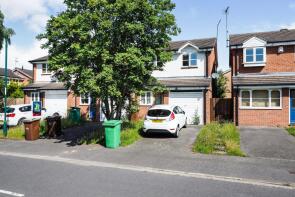
House Prices in Lenton
House prices in Lenton have an overall average of £259,554 over the last year.
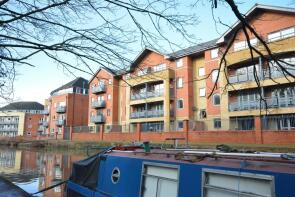
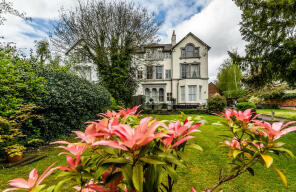
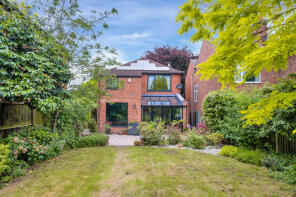
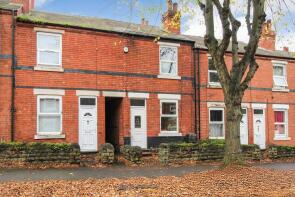
The majority of properties sold in Lenton during the last year were terraced properties, selling for an average price of £234,239. Flats sold for an average of £216,034, with detached properties fetching £397,900.
Overall, the historical sold prices in Lenton over the last year were 4% down on the previous year and similar to the 2021 peak of £257,386.
Properties Sold
22, Allington Avenue, Nottingham NG7 1JX


| Today | See what it's worth now |
| 13 Jun 2025 | £110,000 |
| 16 Feb 2004 | £83,000 |
2a, Lenton Avenue, Nottingham NG7 1DY
| Today | See what it's worth now |
| 6 Jun 2025 | £290,000 |
| 22 Aug 2014 | £250,000 |
32 Admiral House, The Quays, Castle Quay Close, Nottingham NG7 1HR
| Today | See what it's worth now |
| 6 Jun 2025 | £180,000 |
| 29 May 2019 | £185,000 |
17 Marine House, The Quays, Castle Quay Close, Nottingham NG7 1HR
| Today | See what it's worth now |
| 5 Jun 2025 | £185,500 |
| 11 Dec 2006 | £197,450 |
No other historical records.
Apartment 3, The Gallery, Hope Drive, Nottingham NG7 1BT
| Today | See what it's worth now |
| 4 Jun 2025 | £195,100 |
| 6 Nov 2015 | £149,950 |
115, Castle Boulevard, Nottingham NG7 1FE
| Today | See what it's worth now |
| 29 May 2025 | £375,000 |
| 13 Dec 2019 | £283,000 |
Flat 11, 8 Castle Point, Castle Boulevard, Nottingham NG7 1FL

| Today | See what it's worth now |
| 23 May 2025 | £285,000 |
| 21 Feb 2017 | £275,000 |
29, Falcon Close, Nottingham NG7 2DL
| Today | See what it's worth now |
| 9 May 2025 | £200,000 |
| 14 Mar 2011 | £110,000 |
24, Lenton Avenue, Nottingham NG7 1DY
| Today | See what it's worth now |
| 23 Apr 2025 | £315,000 |
| 5 May 2022 | £340,000 |
Journeys End, Cavendish Crescent North, Nottingham NG7 1AY
| Today | See what it's worth now |
| 4 Apr 2025 | £620,000 |
No other historical records.
1, Haddon House, Cavendish Crescent North, Nottingham NG7 1AZ

| Today | See what it's worth now |
| 31 Mar 2025 | £325,000 |
| 28 Feb 2023 | £360,000 |
20, Ashburnham Avenue, Nottingham NG7 1QD

| Today | See what it's worth now |
| 31 Mar 2025 | £312,000 |
No other historical records.
Apartment 5, 1, Harrington Drive, Nottingham NG7 1JQ
| Today | See what it's worth now |
| 31 Mar 2025 | £238,000 |
| 20 Dec 2017 | £205,000 |
No other historical records.
79, Alderney Street, Nottingham NG7 1HD
| Today | See what it's worth now |
| 31 Mar 2025 | £55,000 |
| 30 Jan 2004 | £69,000 |
36, Fishpond Drive, Nottingham NG7 1DG
| Today | See what it's worth now |
| 28 Mar 2025 | £393,500 |
| 27 Jul 2022 | £390,000 |
Flat 14, Park Edge, Barrack Lane, Nottingham NG7 1EZ
| Today | See what it's worth now |
| 27 Mar 2025 | £249,950 |
| 26 Jul 2019 | £252,000 |
No other historical records.
41, Heron Drive, Nottingham NG7 2DE
| Today | See what it's worth now |
| 27 Mar 2025 | £215,000 |
| 7 Sep 2020 | �£160,000 |
20, Dukes Wharf, Nottingham NG7 1GD
| Today | See what it's worth now |
| 26 Mar 2025 | £220,000 |
| 26 Jan 2018 | £193,000 |
Flat 11, 7, Pelham Crescent, Nottingham NG7 1AU
| Today | See what it's worth now |
| 26 Mar 2025 | £189,000 |
| 30 Sep 2021 | £175,000 |
377, Derby Road, Nottingham NG7 2EB
| Today | See what it's worth now |
| 25 Mar 2025 | £545,000 |
| 15 Aug 2019 | £380,000 |
No other historical records.
149, Allington Avenue, Nottingham NG7 1JY
| Today | See what it's worth now |
| 25 Mar 2025 | £170,000 |
| 10 Feb 2017 | £105,000 |
5, Friars Court, Nottingham NG7 1EW
| Today | See what it's worth now |
| 21 Mar 2025 | £250,000 |
| 1 Nov 1995 | £73,500 |
No other historical records.
14, Grove Road, Nottingham NG7 1HJ

| Today | See what it's worth now |
| 19 Mar 2025 | £230,000 |
No other historical records.
85, The Quays, Castle Quay Close, Nottingham NG7 1HT
| Today | See what it's worth now |
| 14 Mar 2025 | £317,500 |
| 21 Dec 2021 | £267,500 |
15, Peregrine Close, Nottingham NG7 2DY

| Today | See what it's worth now |
| 10 Mar 2025 | £187,000 |
| 19 Dec 2008 | £91,000 |
Get ready with a Mortgage in Principle
- Personalised result in just 20 minutes
- Find out how much you can borrow
- Get viewings faster with agents
- No impact on your credit score
What's your property worth?
Source Acknowledgement: © Crown copyright. England and Wales house price data is publicly available information produced by the HM Land Registry.This material was last updated on 6 August 2025. It covers the period from 1 January 1995 to 30 June 2025 and contains property transactions which have been registered during that period. Contains HM Land Registry data © Crown copyright and database right 2025. This data is licensed under the Open Government Licence v3.0.
Disclaimer: Rightmove.co.uk provides this HM Land Registry data "as is". The burden for fitness of the data relies completely with the user and is provided for informational purposes only. No warranty, express or implied, is given relating to the accuracy of content of the HM Land Registry data and Rightmove does not accept any liability for error or omission. If you have found an error with the data or need further information please contact HM Land Registry.
Permitted Use: Viewers of this Information are granted permission to access this Crown copyright material and to download it onto electronic, magnetic, optical or similar storage media provided that such activities are for private research, study or in-house use only. Any other use of the material requires the formal written permission of Land Registry which can be requested from us, and is subject to an additional licence and associated charge.
Map data ©OpenStreetMap contributors.
Rightmove takes no liability for your use of, or reliance on, Rightmove's Instant Valuation due to the limitations of our tracking tool listed here. Use of this tool is taken entirely at your own risk. All rights reserved.