
House Prices in Little Chart
House prices in Little Chart have an overall average of £622,500 over the last year.
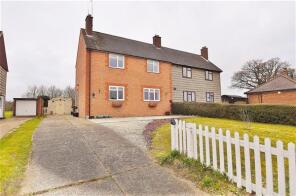
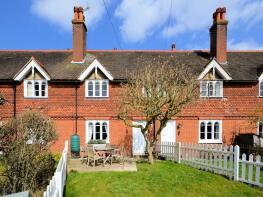
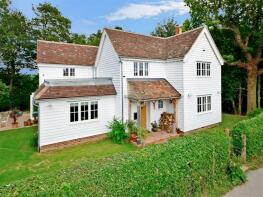
The majority of properties sold in Little Chart during the last year were detached properties, selling for an average price of £855,000. Semi-detached properties sold for an average of £430,000, with terraced properties fetching £350,000.
Overall, the historical sold prices in Little Chart over the last year were 35% down on the 2021 peak of £963,500.
Properties Sold
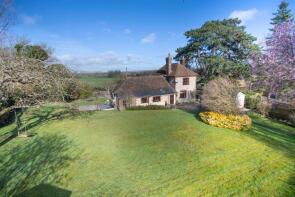
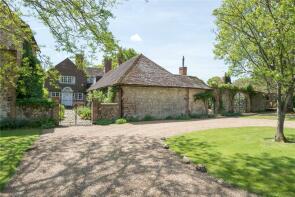
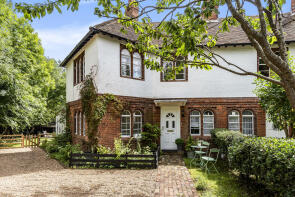
Thatch, Ram Lane, Ashford TN27 0PU

| Today | See what it's worth now |
| 31 Mar 2025 | £1,125,000 |
| 30 Sep 2021 | £1,050,000 |
Stour House, The Street, Ashford TN27 0QB


| Today | See what it's worth now |
| 30 Jan 2025 | £585,000 |
No other historical records.
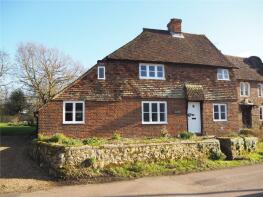
5, The Terrace, The Street, Little Chart TN27 0QB
| Today | See what it's worth now |
| 9 Jan 2025 | £350,000 |
No other historical records.
The White House, The Street, Little Chart TN27 0QA
| Today | See what it's worth now |
| 9 Jan 2025 | £430,000 |
No other historical records.
4, The Terrace, The Street, Ashford TN27 0QB

| Today | See what it's worth now |
| 14 Sep 2022 | £380,000 |
| 3 Feb 2016 | £270,000 |
2, Rooting Street Cottages, Rooting Lane, Ashford TN27 0PY
| Today | See what it's worth now |
| 10 Feb 2022 | £575,000 |
No other historical records.
Nettlepole, Nettlepole Lane, Ashford TN27 0QJ
| Today | See what it's worth now |
| 9 Jun 2021 | £877,000 |
| 28 Mar 2013 | £485,000 |
No other historical records.
Chart Court Cottage, Pluckley Road, Ashford TN27 0QH
| Today | See what it's worth now |
| 16 Jul 2020 | £500,000 |
No other historical records.
The Nook, The Street, Ashford TN27 0QB
| Today | See what it's worth now |
| 12 May 2020 | £425,000 |
No other historical records.
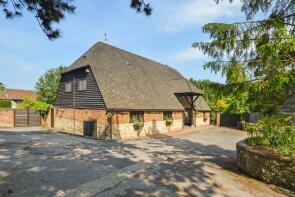
Chart Court Barn, Pluckley Road, Ashford TN27 0QH
| Today | See what it's worth now |
| 7 May 2020 | £745,000 |
No other historical records.
2, The Terrace, The Street, Ashford TN27 0QB
| Today | See what it's worth now |
| 31 Oct 2018 | £388,000 |
| 20 Oct 2015 | £225,000 |
No other historical records.
The Granary, Ram Lane, Ashford TN27 0PU
| Today | See what it's worth now |
| 5 Sep 2018 | £1,077,500 |
No other historical records.
Little Chart Cottage, The Street, Ashford TN27 0QB

| Today | See what it's worth now |
| 29 Jun 2018 | £356,300 |
| 5 Sep 2003 | £225,000 |
No other historical records.
Rooting Street Farmhouse, Rooting Lane, Ashford TN27 0PX

| Today | See what it's worth now |
| 25 Sep 2017 | £780,000 |
No other historical records.
13, Bannister Houses, The Street, Ashford TN27 0QF
| Today | See what it's worth now |
| 17 Feb 2017 | £333,000 |
| 24 Feb 2012 | £165,000 |
3, The Terrace, The Street, Ashford TN27 0QB
| Today | See what it's worth now |
| 30 Sep 2016 | £345,000 |
| 12 Jun 2013 | £265,000 |
1, Surrenden Dering, Surrenden Road, Ashford TN27 0PR

| Today | See what it's worth now |
| 31 Aug 2016 | £365,000 |
No other historical records.
Nettlepole Cottage, Nettlepole Lane, Ashford TN27 0QJ
| Today | See what it's worth now |
| 14 Dec 2015 | £757,500 |
| 19 Dec 2013 | £387,000 |
No other historical records.
3 Field View, The Street, Ashford TN27 0QD
| Today | See what it's worth now |
| 19 Oct 2015 | £327,000 |
| 16 Aug 2007 | £248,000 |
Dering Cottage, Swan Lane, Ashford TN27 0PT
| Today | See what it's worth now |
| 13 Jul 2015 | £355,000 |
| 28 Feb 2006 | £275,000 |
No other historical records.
Langley House, The Street, Ashford TN27 0QA
| Today | See what it's worth now |
| 18 Dec 2014 | £389,000 |
| 24 Apr 2007 | £370,000 |
Evensford, Ram Lane, Ashford TN27 0PU

| Today | See what it's worth now |
| 14 Aug 2014 | £600,000 |
| 3 Nov 2005 | £400,000 |
No other historical records.
3, Surrenden Dering, Surrenden Road, Pluckley TN27 0PR
| Today | See what it's worth now |
| 25 Jul 2014 | £695,000 |
No other historical records.
1, Rooting Street Cottages, Rooting Lane, Ashford TN27 0PY
| Today | See what it's worth now |
| 15 Jan 2014 | £250,000 |
No other historical records.
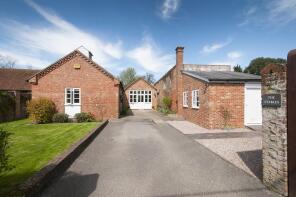
The Stables, Surrenden Road, Ashford TN27 0PR
| Today | See what it's worth now |
| 4 Oct 2013 | £560,000 |
| 20 Dec 2005 | £435,000 |
Get ready with a Mortgage in Principle
- Personalised result in just 20 minutes
- Find out how much you can borrow
- Get viewings faster with agents
- No impact on your credit score
What's your property worth?
Source Acknowledgement: © Crown copyright. England and Wales house price data is publicly available information produced by the HM Land Registry.This material was last updated on 6 August 2025. It covers the period from 1 January 1995 to 30 June 2025 and contains property transactions which have been registered during that period. Contains HM Land Registry data © Crown copyright and database right 2025. This data is licensed under the Open Government Licence v3.0.
Disclaimer: Rightmove.co.uk provides this HM Land Registry data "as is". The burden for fitness of the data relies completely with the user and is provided for informational purposes only. No warranty, express or implied, is given relating to the accuracy of content of the HM Land Registry data and Rightmove does not accept any liability for error or omission. If you have found an error with the data or need further information please contact HM Land Registry.
Permitted Use: Viewers of this Information are granted permission to access this Crown copyright material and to download it onto electronic, magnetic, optical or similar storage media provided that such activities are for private research, study or in-house use only. Any other use of the material requires the formal written permission of Land Registry which can be requested from us, and is subject to an additional licence and associated charge.
Map data ©OpenStreetMap contributors.
Rightmove takes no liability for your use of, or reliance on, Rightmove's Instant Valuation due to the limitations of our tracking tool listed here. Use of this tool is taken entirely at your own risk. All rights reserved.