
House Prices in Llandaff North
House prices in Llandaff North have an overall average of £323,004 over the last year.
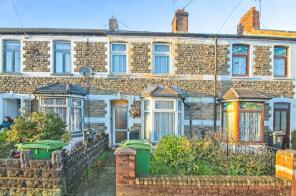
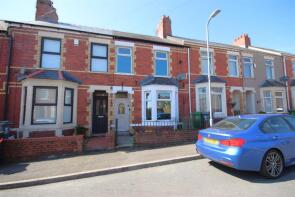
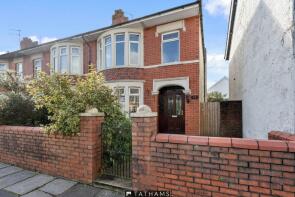
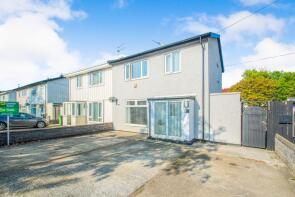
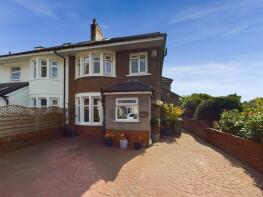
The majority of properties sold in Llandaff North during the last year were semi-detached properties, selling for an average price of £353,803. Terraced properties sold for an average of £293,544, with detached properties fetching £384,500.
Overall, the historical sold prices in Llandaff North over the last year were 12% up on the previous year and 6% up on the 2022 peak of £305,492.
Properties Sold
36, Festiniog Road, Llandaff North, Cardiff CF14 2QS
| Today | See what it's worth now |
| 20 Jun 2025 | £300,000 |
| 31 Aug 2005 | £140,000 |
No other historical records.
45, College Road, Llandaff North, Cardiff CF14 2HZ
| Today | See what it's worth now |
| 20 Jun 2025 | £300,000 |
| 29 Jan 2021 | £275,000 |
7, Heol Gabriel, Whitchurch, Cardiff CF14 1JS
| Today | See what it's worth now |
| 5 Jun 2025 | £395,000 |
| 23 Nov 2012 | £200,000 |
No other historical records.
50, Copleston Road, Llandaff North, Cardiff CF14 2JF
| Today | See what it's worth now |
| 29 May 2025 | £376,500 |
| 31 Oct 2003 | £139,000 |
No other historical records.
26, Coed Arian, Whitchurch, Cardiff CF14 2ND
| Today | See what it's worth now |
| 16 May 2025 | £403,000 |
No other historical records.
1, Llandinam Crescent, Llandaff North, Cardiff CF14 2RB


| Today | See what it's worth now |
| 2 May 2025 | £403,000 |
| 17 May 2002 | £128,000 |
No other historical records.
59, Clarbeston Road, Llandaff North, Cardiff CF14 2LP

| Today | See what it's worth now |
| 25 Apr 2025 | £270,000 |
| 31 Mar 2008 | £173,000 |
38, Gabalfa Avenue, Llandaff North, Cardiff CF14 2SJ
| Today | See what it's worth now |
| 25 Apr 2025 | £229,900 |
No other historical records.
21, Hazelhurst Road, Llandaff North, Cardiff CF14 2FW
| Today | See what it's worth now |
| 25 Apr 2025 | £345,000 |
| 27 Mar 2006 | £90,000 |
No other historical records.
31, Cornelly Street, Llandaff North, Cardiff CF14 2HQ

| Today | See what it's worth now |
| 11 Apr 2025 | £120,000 |
| 7 Mar 2012 | £77,000 |
No other historical records.
48, Colwill Road, Llandaff North, Cardiff CF14 2QR
| Today | See what it's worth now |
| 11 Apr 2025 | £275,000 |
| 5 Mar 2018 | £168,000 |
No other historical records.
34, Birchgrove Road, Heath, Cardiff CF14 1RS
| Today | See what it's worth now |
| 4 Apr 2025 | £240,000 |
No other historical records.
8, Violet Place, Whitchurch, Cardiff CF14 1HT
| Today | See what it's worth now |
| 3 Apr 2025 | £210,000 |
| 18 Dec 2001 | £41,500 |
No other historical records.
11, Pantbach Road, Heath, Cardiff CF14 1TU
| Today | See what it's worth now |
| 1 Apr 2025 | £330,000 |
| 21 Jul 2022 | £325,000 |
No other historical records.
38, Aberdulais Road, Llandaff North, Cardiff CF14 2PJ
| Today | See what it's worth now |
| 28 Mar 2025 | £245,000 |
| 22 Feb 2019 | £212,000 |
No other historical records.
39, Cromwell Road, Heath, Cardiff CF14 1UQ
| Today | See what it's worth now |
| 28 Mar 2025 | £460,000 |
| 29 Oct 2015 | £347,000 |
184, Aberporth Road, Llandaff North, Cardiff CF14 2PS
| Today | See what it's worth now |
| 28 Mar 2025 | £120,000 |
| 1 Nov 2021 | £191,500 |
No other historical records.
42, Ty-mawr Road, Llandaff North, Cardiff CF14 2FN
| Today | See what it's worth now |
| 12 Mar 2025 | £330,000 |
| 2 Nov 2018 | £231,005 |
25, Gabalfa Avenue, Llandaff North, Cardiff CF14 2SG

| Today | See what it's worth now |
| 7 Mar 2025 | £280,000 |
| 16 Jan 2017 | £160,000 |
22, Manor Way, Whitchurch, Cardiff CF14 1RG
| Today | See what it's worth now |
| 5 Mar 2025 | £374,000 |
| 6 Dec 2019 | £247,500 |
3, Holly Terrace, Llandaff North, Cardiff CF14 2JD

| Today | See what it's worth now |
| 4 Mar 2025 | £172,000 |
No other historical records.
18, Heol Gabriel, Whitchurch, Cardiff CF14 1JT
| Today | See what it's worth now |
| 27 Feb 2025 | £460,000 |
No other historical records.
136, College Road, Llandaff North, Cardiff CF14 2NY
| Today | See what it's worth now |
| 18 Feb 2025 | £310,000 |
| 28 Jun 2012 | £96,000 |
22, Llandinam Crescent, Llandaff North, Cardiff CF14 2RB
| Today | See what it's worth now |
| 18 Feb 2025 | £250,000 |
| 14 May 2004 | £158,000 |
30, Manor Way, Whitchurch, Cardiff CF14 1RH
| Today | See what it's worth now |
| 12 Feb 2025 | £360,000 |
| 30 May 2014 | £225,000 |
No other historical records.
Get ready with a Mortgage in Principle
- Personalised result in just 20 minutes
- Find out how much you can borrow
- Get viewings faster with agents
- No impact on your credit score
What's your property worth?
Source Acknowledgement: © Crown copyright. England and Wales house price data is publicly available information produced by the HM Land Registry.This material was last updated on 6 August 2025. It covers the period from 1 January 1995 to 30 June 2025 and contains property transactions which have been registered during that period. Contains HM Land Registry data © Crown copyright and database right 2025. This data is licensed under the Open Government Licence v3.0.
Disclaimer: Rightmove.co.uk provides this HM Land Registry data "as is". The burden for fitness of the data relies completely with the user and is provided for informational purposes only. No warranty, express or implied, is given relating to the accuracy of content of the HM Land Registry data and Rightmove does not accept any liability for error or omission. If you have found an error with the data or need further information please contact HM Land Registry.
Permitted Use: Viewers of this Information are granted permission to access this Crown copyright material and to download it onto electronic, magnetic, optical or similar storage media provided that such activities are for private research, study or in-house use only. Any other use of the material requires the formal written permission of Land Registry which can be requested from us, and is subject to an additional licence and associated charge.
Map data ©OpenStreetMap contributors.
Rightmove takes no liability for your use of, or reliance on, Rightmove's Instant Valuation due to the limitations of our tracking tool listed here. Use of this tool is taken entirely at your own risk. All rights reserved.