
House Prices in Manningham
House prices in Manningham have an overall average of £149,773 over the last year.
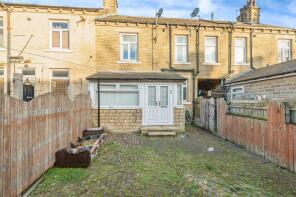
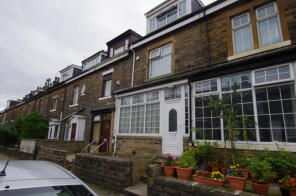
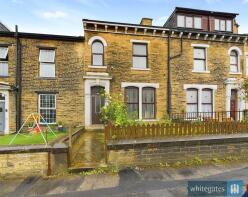
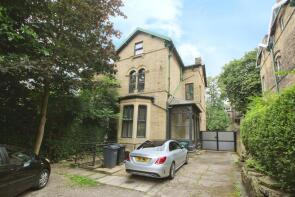
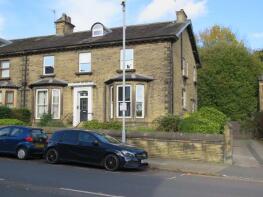
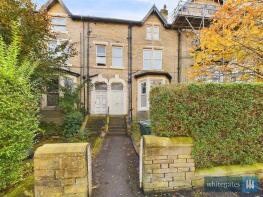
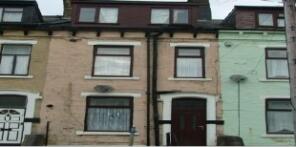
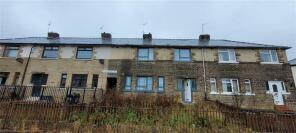
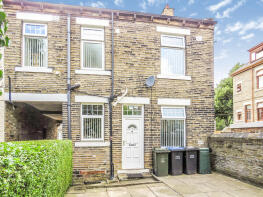
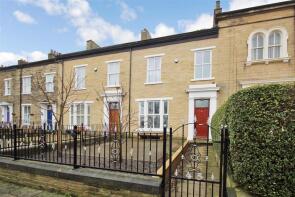
The majority of properties sold in Manningham during the last year were terraced properties, selling for an average price of £129,588. Detached properties sold for an average of £287,500, with semi-detached properties fetching £231,000.
Overall, the historical sold prices in Manningham over the last year were 63% up on the previous year and 21% up on the 2008 peak of £123,955.
Properties Sold
Apartment 326 Silk Warehouse, Lister Mills, Lilycroft Road, Bradford BD9 5BD

| Today | See what it's worth now |
| 6 Jun 2025 | £55,000 |
| 15 Jun 2006 | £133,000 |
No other historical records.
Flat 1, 47, Blenheim Road, Bradford BD8 7LH


| Today | See what it's worth now |
| 23 May 2025 | £90,000 |
| 17 Nov 2000 | £60,000 |
13, Glenholme Road, Bradford BD8 9DR
| Today | See what it's worth now |
| 23 May 2025 | £102,000 |
| 23 May 2017 | £69,950 |
23, Farfield Terrace, Bradford BD9 5AY
| Today | See what it's worth now |
| 16 May 2025 | £145,000 |
| 25 May 2007 | £110,000 |
No other historical records.
1, Glenholme Road, Bradford BD8 9DR

| Today | See what it's worth now |
| 8 Apr 2025 | £110,000 |
| 4 Oct 2006 | £110,000 |
23, Chatsworth Place, Bradford BD8 7PY
| Today | See what it's worth now |
| 28 Mar 2025 | £160,000 |
| 6 Mar 2008 | £119,500 |
289, Hollings Road, Bradford BD8 8NU

| Today | See what it's worth now |
| 12 Mar 2025 | £60,000 |
| 28 Jun 2002 | £14,000 |
22, Morningside, Bradford BD8 8QR

| Today | See what it's worth now |
| 11 Mar 2025 | £245,000 |
| 16 Nov 2004 | £50,000 |
No other historical records.
17, Springcliffe, Bradford BD8 8QP
| Today | See what it's worth now |
| 21 Feb 2025 | £210,000 |
| 22 Jul 1996 | £54,000 |
No other historical records.
9, Parkfield Road, Bradford BD8 7AB
| Today | See what it's worth now |
| 13 Feb 2025 | £375,000 |
| 30 May 2019 | £228,000 |
No other historical records.
10, Oak Lane, Bradford BD9 4PX
| Today | See what it's worth now |
| 28 Jan 2025 | £330,000 |
| 14 Jan 2008 | �£71,454 |
41, Leamington Street, Bradford BD9 4QZ

| Today | See what it's worth now |
| 26 Jan 2025 | £150,000 |
| 4 Feb 2010 | £116,000 |
No other historical records.
39, St Pauls Road, Manningham, Bradford BD8 7LP
| Today | See what it's worth now |
| 13 Jan 2025 | £259,000 |
No other historical records.
18, Morningside, Bradford BD8 8QR
| Today | See what it's worth now |
| 18 Dec 2024 | £85,000 |
No other historical records.
108, White Abbey Road, Bradford BD8 8DP
| Today | See what it's worth now |
| 3 Dec 2024 | £146,000 |
No other historical records.
19, Glenton Square, Bradford BD9 4SP

| Today | See what it's worth now |
| 13 Nov 2024 | £135,000 |
| 11 Jun 2001 | £43,000 |
No other historical records.
50, Beaumont Road, Bradford BD8 9DT
| Today | See what it's worth now |
| 5 Nov 2024 | £87,000 |
| 4 Jul 2003 | £24,500 |
No other historical records.
27, Blenheim Road, Bradford BD8 7LH

| Today | See what it's worth now |
| 25 Oct 2024 | £160,000 |
| 22 Jan 2006 | £80,000 |
45, Southfield Square, Bradford BD8 7SL
| Today | See what it's worth now |
| 27 Sep 2024 | £160,000 |
| 20 Dec 2010 | £50,000 |
No other historical records.
277, Hollings Road, Bradford BD8 8NU

| Today | See what it's worth now |
| 25 Sep 2024 | £51,000 |
| 30 Mar 2012 | £70,000 |
No other historical records.
27, Home View Terrace, Bradford BD8 8QU

| Today | See what it's worth now |
| 23 Sep 2024 | £70,000 |
| 31 Aug 2011 | £80,000 |
No other historical records.
25, Lister View, Bradford BD8 8DJ
| Today | See what it's worth now |
| 20 Sep 2024 | £110,000 |
| 20 Aug 2021 | £108,250 |
9, Walmer Villas, Bradford BD8 7ET

| Today | See what it's worth now |
| 23 Aug 2024 | £226,000 |
| 29 Oct 2001 | £123,000 |
No other historical records.
35, Lister Gardens, Oak Avenue, Bradford BD8 7AG

| Today | See what it's worth now |
| 16 Aug 2024 | £50,000 |
| 24 Mar 2005 | £43,000 |
19, Lister Gardens, Oak Avenue, Bradford BD8 7AG
| Today | See what it's worth now |
| 1 Aug 2024 | £77,000 |
| 18 Dec 2006 | £60,500 |
Get ready with a Mortgage in Principle
- Personalised result in just 20 minutes
- Find out how much you can borrow
- Get viewings faster with agents
- No impact on your credit score
What's your property worth?
Source Acknowledgement: © Crown copyright. England and Wales house price data is publicly available information produced by the HM Land Registry.This material was last updated on 6 August 2025. It covers the period from 1 January 1995 to 30 June 2025 and contains property transactions which have been registered during that period. Contains HM Land Registry data © Crown copyright and database right 2025. This data is licensed under the Open Government Licence v3.0.
Disclaimer: Rightmove.co.uk provides this HM Land Registry data "as is". The burden for fitness of the data relies completely with the user and is provided for informational purposes only. No warranty, express or implied, is given relating to the accuracy of content of the HM Land Registry data and Rightmove does not accept any liability for error or omission. If you have found an error with the data or need further information please contact HM Land Registry.
Permitted Use: Viewers of this Information are granted permission to access this Crown copyright material and to download it onto electronic, magnetic, optical or similar storage media provided that such activities are for private research, study or in-house use only. Any other use of the material requires the formal written permission of Land Registry which can be requested from us, and is subject to an additional licence and associated charge.
Map data ©OpenStreetMap contributors.
Rightmove takes no liability for your use of, or reliance on, Rightmove's Instant Valuation due to the limitations of our tracking tool listed here. Use of this tool is taken entirely at your own risk. All rights reserved.