
House Prices in Manningtree
House prices in Manningtree have an overall average of £390,190 over the last year.
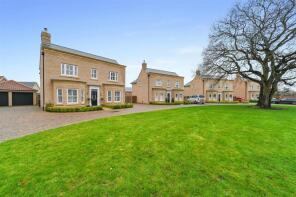
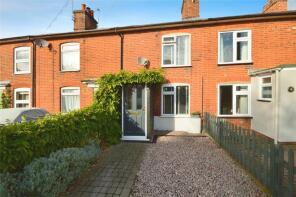
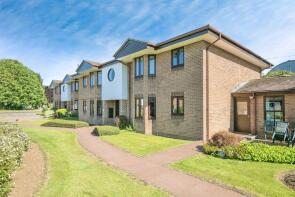
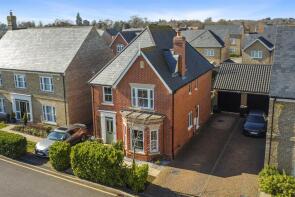
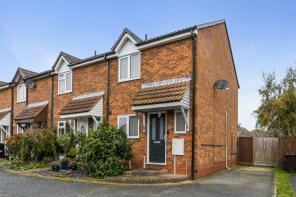
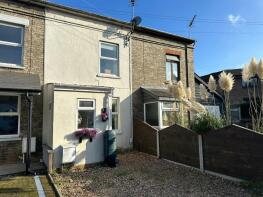
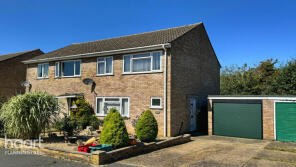
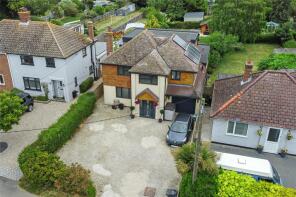
The majority of properties sold in Manningtree during the last year were detached properties, selling for an average price of £501,279. Semi-detached properties sold for an average of £329,852, with terraced properties fetching £309,941.
Overall, the historical sold prices in Manningtree over the last year were similar to the previous year and similar to the 2022 peak of £388,391.
Properties Sold
2, Harvey Close, Manningtree CO11 2HW

| Today | See what it's worth now |
| 25 Jun 2025 | £405,000 |
| 18 Jul 2022 | £415,000 |
Flat 25, Secret Bunker, Shrubland Road, Manningtree CO11 1HS
| Today | See what it's worth now |
| 6 Jun 2025 | £170,000 |
| 23 Oct 2020 | £150,000 |
No other historical records.
31, Storeys Road, Manningtree CO11 1FP

| Today | See what it's worth now |
| 6 Jun 2025 | £265,000 |
| 27 May 2022 | £275,000 |
No other historical records.
8, Stourdale Close, Lawford CO11 2HY
| Today | See what it's worth now |
| 5 Jun 2025 | £500,000 |
No other historical records.
17 Berrenlea, New Road, Manningtree CO11 2AE
| Today | See what it's worth now |
| 3 Jun 2025 | £625,000 |
| 17 Dec 2010 | £300,000 |
No other historical records.
1, Chester Grove, Manningtree CO11 2FA
| Today | See what it's worth now |
| 23 May 2025 | £465,000 |
| 29 Mar 2018 | £375,000 |
No other historical records.
5, The Hollies, Manningtree CO11 2FX
| Today | See what it's worth now |
| 23 May 2025 | £725,000 |
| 1 Mar 2022 | £635,000 |
No other historical records.
3, Barnfield Terrace, Barnfield, Manningtree CO11 2AD
| Today | See what it's worth now |
| 22 May 2025 | £279,500 |
| 19 Apr 2016 | £174,000 |
8, Swan Court, Manningtree CO11 1LN
| Today | See what it's worth now |
| 21 May 2025 | £115,000 |
| 18 Dec 1998 | £35,000 |
No other historical records.
6, Chester Grove, Manningtree CO11 2FA
| Today | See what it's worth now |
| 20 May 2025 | £550,000 |
| 9 Nov 2017 | £410,000 |
No other historical records.
14, Cambridge Drive, Manningtree CO11 2EN
| Today | See what it's worth now |
| 20 May 2025 | £775,000 |
| 6 Jul 2017 | £550,000 |
No other historical records.
Apartment 14, The Quayside Maltings, High Street, Mistley CO11 1AL
| Today | See what it's worth now |
| 8 May 2025 | £220,000 |
| 22 Dec 2005 | £245,000 |
No other historical records.
9, Steam Mill Close, Manningtree CO11 2FF
| Today | See what it's worth now |
| 25 Apr 2025 | £645,000 |
| 22 Nov 2019 | £580,000 |
No other historical records.
43, California Road, Manningtree CO11 1JA
| Today | See what it's worth now |
| 17 Apr 2025 | £275,000 |
| 24 Aug 2016 | £207,000 |
26, Lydgate Close, Manningtree CO11 2SU
| Today | See what it's worth now |
| 17 Apr 2025 | £295,000 |
| 19 Nov 2020 | £275,000 |
53, California Road, Manningtree CO11 1JD
| Today | See what it's worth now |
| 16 Apr 2025 | £200,000 |
| 29 Mar 2021 | £162,500 |
107, Stourview Avenue, Manningtree CO11 1UF
| Today | See what it's worth now |
| 4 Apr 2025 | £273,000 |
| 15 May 2020 | £245,000 |
No other historical records.
51, School Lane, Manningtree CO11 2JA
| Today | See what it's worth now |
| 31 Mar 2025 | £695,000 |
| 1 May 2015 | £307,500 |
No other historical records.
126, Stourview Avenue, Manningtree CO11 1UF
| Today | See what it's worth now |
| 31 Mar 2025 | £327,500 |
| 13 Aug 2007 | £160,000 |
No other historical records.
11, South Street, Manningtree CO11 1BB
| Today | See what it's worth now |
| 31 Mar 2025 | £736,000 |
| 25 Mar 2002 | £350,000 |
No other historical records.
2, Sienna Grove, Manningtree CO11 2FU


| Today | See what it's worth now |
| 31 Mar 2025 | £615,000 |
| 20 Sep 2019 | £499,995 |
No other historical records.
70, Harwich Road, Manningtree CO11 1LP
| Today | See what it's worth now |
| 31 Mar 2025 | £155,000 |
| 21 Jun 1995 | £34,000 |
No other historical records.
7, Barley Close, Manningtree CO11 1GA
| Today | See what it's worth now |
| 31 Mar 2025 | £505,000 |
| 16 Feb 2018 | £332,500 |
Flat 8, Free Rodwell House, School Lane, Manningtree CO11 1HW

| Today | See what it's worth now |
| 31 Mar 2025 | £155,000 |
| 28 Jul 2005 | £124,000 |
No other historical records.
19, Brunswick Gardens, Manningtree CO11 1FN
| Today | See what it's worth now |
| 31 Mar 2025 | £440,000 |
| 8 Dec 2020 | £345,000 |
No other historical records.
Get ready with a Mortgage in Principle
- Personalised result in just 20 minutes
- Find out how much you can borrow
- Get viewings faster with agents
- No impact on your credit score
What's your property worth?
Source Acknowledgement: © Crown copyright. England and Wales house price data is publicly available information produced by the HM Land Registry.This material was last updated on 6 August 2025. It covers the period from 1 January 1995 to 30 June 2025 and contains property transactions which have been registered during that period. Contains HM Land Registry data © Crown copyright and database right 2025. This data is licensed under the Open Government Licence v3.0.
Disclaimer: Rightmove.co.uk provides this HM Land Registry data "as is". The burden for fitness of the data relies completely with the user and is provided for informational purposes only. No warranty, express or implied, is given relating to the accuracy of content of the HM Land Registry data and Rightmove does not accept any liability for error or omission. If you have found an error with the data or need further information please contact HM Land Registry.
Permitted Use: Viewers of this Information are granted permission to access this Crown copyright material and to download it onto electronic, magnetic, optical or similar storage media provided that such activities are for private research, study or in-house use only. Any other use of the material requires the formal written permission of Land Registry which can be requested from us, and is subject to an additional licence and associated charge.
Map data ©OpenStreetMap contributors.
Rightmove takes no liability for your use of, or reliance on, Rightmove's Instant Valuation due to the limitations of our tracking tool listed here. Use of this tool is taken entirely at your own risk. All rights reserved.