
House Prices in Mayford
House prices in Mayford have an overall average of £675,347 over the last year.
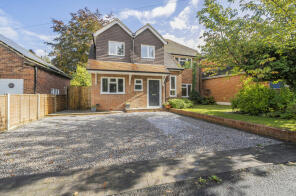
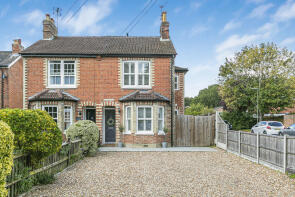
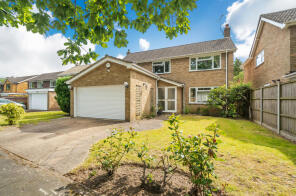
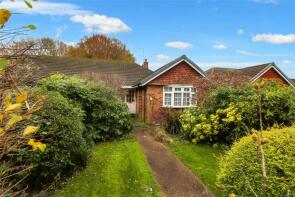
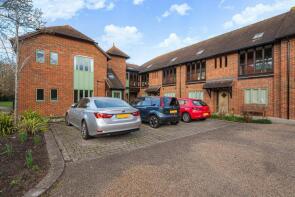
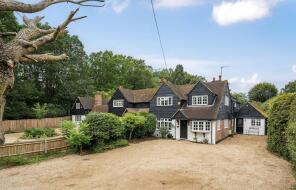
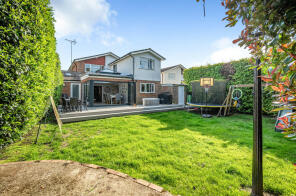
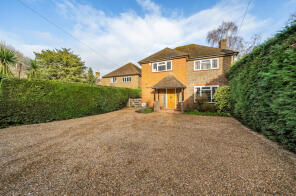
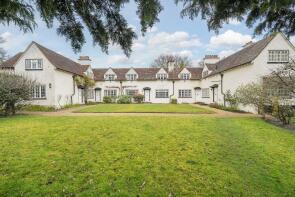
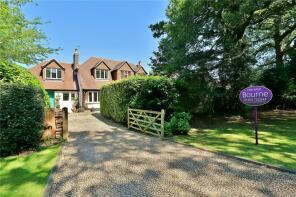
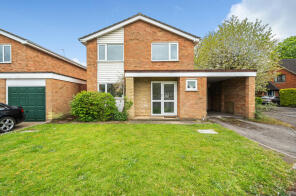
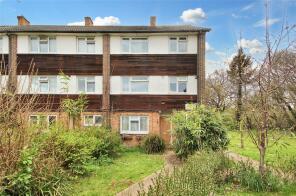
The majority of properties sold in Mayford during the last year were detached properties, selling for an average price of £853,607. Flats sold for an average of £404,750, with semi-detached properties fetching £678,179.
Overall, the historical sold prices in Mayford over the last year were 15% down on the previous year and 9% down on the 2022 peak of £741,688.
Properties Sold
13, Rose Bank Cottages, Westfield, Woking GU22 9QZ
| Today | See what it's worth now |
| 16 Jun 2025 | £605,000 |
| 29 Feb 2000 | £182,500 |
No other historical records.
7, Bonsey Close, Westfield, Woking GU22 9PS
| Today | See what it's worth now |
| 15 May 2025 | £350,000 |
| 15 May 2015 | £280,000 |
Flat 11, 99 Mayford Grange, Westfield Road, Westfield, Woking GU22 9AX
| Today | See what it's worth now |
| 14 May 2025 | £250,000 |
| 3 Oct 2014 | £265,000 |
19, Hoad Crescent, Woking GU22 9FQ
| Today | See what it's worth now |
| 30 Apr 2025 | £500,000 |
| 1 May 2015 | £295,000 |
No other historical records.
63, Egley Road, Woking GU22 0AY
| Today | See what it's worth now |
| 31 Mar 2025 | £950,000 |
No other historical records.
2, Matthews Cottages, Westfield Common, Westfield, Woking GU22 9NT
| Today | See what it's worth now |
| 31 Mar 2025 | £668,000 |
| 7 Jun 2019 | £355,000 |
No other historical records.
8, Ellis Farm Close, Mayford, Woking GU22 9QN
| Today | See what it's worth now |
| 18 Mar 2025 | £770,000 |
No other historical records.
3, Egley Drive, Mayford, Woking GU22 0NJ
| Today | See what it's worth now |
| 17 Mar 2025 | £442,500 |
| 2 Feb 2006 | £245,500 |
Flat 13, 99 Mayford Grange, Westfield Road, Westfield, Woking GU22 9AX
| Today | See what it's worth now |
| 11 Mar 2025 | £388,000 |
| 9 Sep 2016 | £375,000 |
36 Orchard Cottage, Smarts Heath Road, Woking GU22 0NP
| Today | See what it's worth now |
| 7 Mar 2025 | £912,500 |
| 11 May 1999 | £220,000 |
No other historical records.
Fern Cottage, Prey Heath Road, Mayford, Woking GU22 0RN

| Today | See what it's worth now |
| 6 Mar 2025 | £710,000 |
| 2 Sep 2014 | £499,950 |
22, Honeypots Road, Mayford, Woking GU22 9QW
| Today | See what it's worth now |
| 19 Feb 2025 | £800,000 |
| 21 Aug 2015 | £617,000 |
Flat 10, 99 Mayford Grange, Westfield Road, Westfield, Woking GU22 9AX


| Today | See what it's worth now |
| 17 Feb 2025 | £335,000 |
| 26 Jan 2018 | £377,500 |
69, Westfield Road, Westfield, Woking GU22 9PX
| Today | See what it's worth now |
| 13 Feb 2025 | £725,000 |
| 9 Aug 2001 | £261,500 |
4, Crosswell Cottages, Goose Lane, Woking GU22 0NW
| Today | See what it's worth now |
| 7 Feb 2025 | £650,000 |
| 28 Apr 2017 | £400,000 |
No other historical records.
Broadoak Cottage, Bonsey Lane, Westfield, Woking GU22 9PP
| Today | See what it's worth now |
| 29 Jan 2025 | £1,035,000 |
No other historical records.
3, The Orchard, Westfield, Woking GU22 9PA
| Today | See what it's worth now |
| 15 Jan 2025 | £617,500 |
No other historical records.
20, Bonsey Lane, Westfield, Woking GU22 9PT
| Today | See what it's worth now |
| 6 Jan 2025 | £280,000 |
| 28 Oct 2022 | £280,000 |
Flat 21, 99 Mayford Grange, Westfield Road, Westfield, Woking GU22 9AX
| Today | See what it's worth now |
| 28 Nov 2024 | £500,000 |
| 22 Feb 2022 | £460,000 |
3, Rose Bank Cottages, Westfield, Woking GU22 9QZ

| Today | See what it's worth now |
| 8 Nov 2024 | £639,250 |
| 29 May 2014 | £450,000 |
Flat 36, 99 Mayford Grange, Westfield Road, Westfield, Woking GU22 9AX
| Today | See what it's worth now |
| 30 Oct 2024 | £425,000 |
| 29 Jan 2010 | £380,000 |
No other historical records.
4, Swift Close, Woking GU22 0AW

| Today | See what it's worth now |
| 8 Oct 2024 | £930,000 |
No other historical records.
4, Whitestone Woods, Woking GU22 0DA

| Today | See what it's worth now |
| 20 Sep 2024 | £770,000 |
No other historical records.
Bart House, Mount Road, Woking GU22 0PY
| Today | See what it's worth now |
| 16 Sep 2024 | £1,725,000 |
| 31 Oct 2014 | £1,160,500 |
1a Willowend, Chiltern Close, Mayford, Woking GU22 0PL

| Today | See what it's worth now |
| 6 Sep 2024 | £720,000 |
| 8 Aug 2012 | £515,000 |
Get ready with a Mortgage in Principle
- Personalised result in just 20 minutes
- Find out how much you can borrow
- Get viewings faster with agents
- No impact on your credit score
What's your property worth?
Source Acknowledgement: © Crown copyright. England and Wales house price data is publicly available information produced by the HM Land Registry.This material was last updated on 6 August 2025. It covers the period from 1 January 1995 to 30 June 2025 and contains property transactions which have been registered during that period. Contains HM Land Registry data © Crown copyright and database right 2025. This data is licensed under the Open Government Licence v3.0.
Disclaimer: Rightmove.co.uk provides this HM Land Registry data "as is". The burden for fitness of the data relies completely with the user and is provided for informational purposes only. No warranty, express or implied, is given relating to the accuracy of content of the HM Land Registry data and Rightmove does not accept any liability for error or omission. If you have found an error with the data or need further information please contact HM Land Registry.
Permitted Use: Viewers of this Information are granted permission to access this Crown copyright material and to download it onto electronic, magnetic, optical or similar storage media provided that such activities are for private research, study or in-house use only. Any other use of the material requires the formal written permission of Land Registry which can be requested from us, and is subject to an additional licence and associated charge.
Map data ©OpenStreetMap contributors.
Rightmove takes no liability for your use of, or reliance on, Rightmove's Instant Valuation due to the limitations of our tracking tool listed here. Use of this tool is taken entirely at your own risk. All rights reserved.