
House Prices in MK45
House prices in MK45 have an overall average of £420,770 over the last year.
The majority of properties sold in MK45 during the last year were semi-detached properties, selling for an average price of £389,907. Detached properties sold for an average of £565,966, with terraced properties fetching £316,639.
Overall, the historical sold prices in MK45 over the last year were 3% down on the previous year and 8% down on the 2022 peak of £455,301.
Properties Sold
1, Goodhall Crescent, Bedford MK45 4AH
| Today | See what it's worth now |
| 23 Jun 2025 | £335,000 |
| 3 Apr 2002 | £129,500 |
No other historical records.
31, Flitwick Road, Bedford MK45 5JA

| Today | See what it's worth now |
| 20 Jun 2025 | £297,000 |
| 24 May 2002 | £110,000 |
No other historical records.
7, Austen Avenue, Bedford MK45 1GP
| Today | See what it's worth now |
| 20 Jun 2025 | £400,000 |
| 28 Jun 2019 | £380,000 |
No other historical records.
27, Hazel Grove, Bedford MK45 4GJ
| Today | See what it's worth now |
| 19 Jun 2025 | £185,000 |
| 18 Dec 2020 | £155,000 |
No other historical records.
14, Ash Tree Covert, Bedford MK45 4GN

| Today | See what it's worth now |
| 17 Jun 2025 | £470,000 |
| 4 Dec 2017 | £362,500 |
No other historical records.
13, Richardson Court, Bedford MK45 2AR
| Today | See what it's worth now |
| 13 Jun 2025 | £640,000 |
| 22 Jul 2016 | £550,000 |
No other historical records.
32, Willow Way, Bedford MK45 2SJ
| Today | See what it's worth now |
| 13 Jun 2025 | £406,000 |
| 20 Oct 2006 | £187,500 |
49, Beaumont Road, Bedford MK45 1AL
| Today | See what it's worth now |
| 13 Jun 2025 | £382,500 |
| 31 Aug 2016 | £311,500 |
2, Manor Way, Bedford MK45 3AH
| Today | See what it's worth now |
| 12 Jun 2025 | £425,000 |
| 28 May 2013 | £248,000 |
No other historical records.
42, Hinksley Road, Bedford MK45 1HH
| Today | See what it's worth now |
| 11 Jun 2025 | £325,000 |
| 7 Aug 2017 | £270,000 |
59, Poppy Drive, Bedford MK45 2AT
| Today | See what it's worth now |
| 8 Jun 2025 | £699,995 |
| 29 Nov 2019 | £600,000 |
No other historical records.
52, High Street, Bedford MK45 5DY
| Today | See what it's worth now |
| 6 Jun 2025 | £515,000 |
| 22 Sep 2017 | £405,000 |
No other historical records.
48, Churchill Drive, Bedford MK45 1FZ


| Today | See what it's worth now |
| 6 Jun 2025 | £449,990 |
| 22 Mar 2024 | £390,000 |
8, Brazier Close, Bedford MK45 4RW
| Today | See what it's worth now |
| 6 Jun 2025 | £360,000 |
| 26 Apr 2012 | £192,500 |
37a, High Street, Bedford MK45 5JG
| Today | See what it's worth now |
| 2 Jun 2025 | £572,000 |
| 12 Oct 2015 | £390,000 |
10, Oatlands Drive, Wixams, Bedford MK45 3NT

| Today | See what it's worth now |
| 30 May 2025 | £475,000 |
| 31 Jul 2020 | £400,000 |
No other historical records.
3, Grasmere Place, Wixams MK45 3SS
| Today | See what it's worth now |
| 27 May 2025 | £378,000 |
| 9 May 2024 | £380,000 |
No other historical records.
27a, Ampthill Road, Bedford MK45 2DA
| Today | See what it's worth now |
| 27 May 2025 | £675,000 |
| 18 Jul 2007 | £425,000 |
59, Wingate Drive, Bedford MK45 2XF
| Today | See what it's worth now |
| 27 May 2025 | £450,000 |
| 3 Nov 2023 | £375,000 |
3, Duck End Lane, Bedford MK45 2DL
| Today | See what it's worth now |
| 23 May 2025 | £665,000 |
| 11 Sep 2015 | £410,000 |
No other historical records.
23, Sharpenhoe Road, Bedford MK45 4SD
| Today | See what it's worth now |
| 12 May 2025 | £255,000 |
| 17 Aug 2016 | £216,200 |
57, The Ridgeway, Bedford MK45 1DJ
| Today | See what it's worth now |
| 7 May 2025 | £630,000 |
| 26 Feb 2014 | £243,000 |
11, Trow Close, Bedford MK45 3BF
| Today | See what it's worth now |
| 7 May 2025 | £290,000 |
| 15 Apr 2014 | £160,000 |
65, Fir Tree Close, Bedford MK45 1NY
| Today | See what it's worth now |
| 7 May 2025 | £327,500 |
| 23 Oct 2020 | £263,000 |
No other historical records.
40, Wagstaff Way, Bedford MK45 2FY
| Today | See what it's worth now |
| 6 May 2025 | £405,000 |
| 10 Aug 2012 | £218,000 |
No other historical records.
Find out how much your property is worth
The following agents can provide you with a free, no-obligation valuation. Simply select the ones you'd like to hear from.
Sponsored
All featured agents have paid a fee to promote their valuation expertise.

Connells
Flitwick

Deakin-White
Dunstable

Love Homes
Flitwick

Taylors Estate Agents
Flitwick

Orchards Estate Agents
Ampthill

Urban & Rural Property Services
Ampthill
Get ready with a Mortgage in Principle
- Personalised result in just 20 minutes
- Find out how much you can borrow
- Get viewings faster with agents
- No impact on your credit score
What's your property worth?
Source Acknowledgement: © Crown copyright. England and Wales house price data is publicly available information produced by the HM Land Registry.This material was last updated on 6 August 2025. It covers the period from 1 January 1995 to 30 June 2025 and contains property transactions which have been registered during that period. Contains HM Land Registry data © Crown copyright and database right 2025. This data is licensed under the Open Government Licence v3.0.
Disclaimer: Rightmove.co.uk provides this HM Land Registry data "as is". The burden for fitness of the data relies completely with the user and is provided for informational purposes only. No warranty, express or implied, is given relating to the accuracy of content of the HM Land Registry data and Rightmove does not accept any liability for error or omission. If you have found an error with the data or need further information please contact HM Land Registry.
Permitted Use: Viewers of this Information are granted permission to access this Crown copyright material and to download it onto electronic, magnetic, optical or similar storage media provided that such activities are for private research, study or in-house use only. Any other use of the material requires the formal written permission of Land Registry which can be requested from us, and is subject to an additional licence and associated charge.
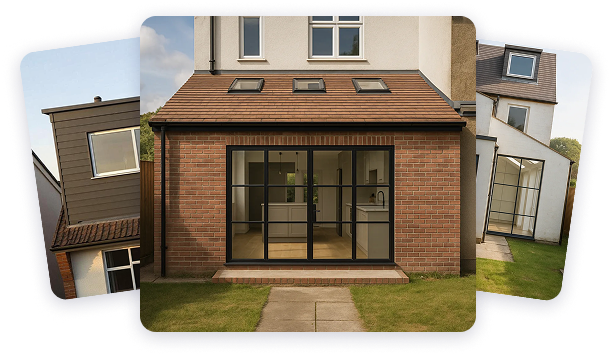
Data on planning applications, home extensions and build costs is provided by Resi.co.uk. Planning data is calculated using the last 2 years of residential applications within the selected planning authority. Home extension data, such as build costs and project timelines, are calculated using approximately 9,000 architectural projects Resi has completed, and 23,500 builders quotes submitted via Resi's platform. Build costs are adjusted according to inflation rates to more accurately represent today's prices.
Map data ©OpenStreetMap contributors.
Rightmove takes no liability for your use of, or reliance on, Rightmove's Instant Valuation due to the limitations of our tracking tool listed here. Use of this tool is taken entirely at your own risk. All rights reserved.