
House Prices in Nevison
House prices in Nevison have an overall average of £201,388 over the last year.
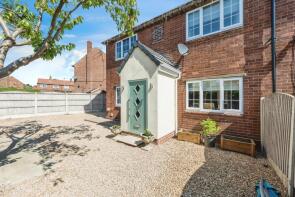
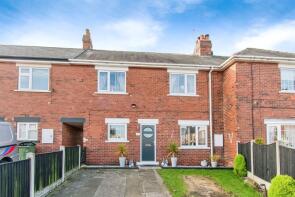
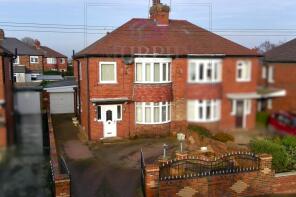
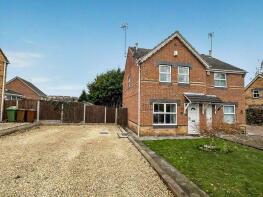
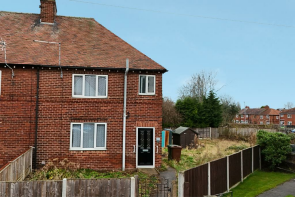
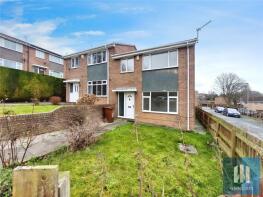
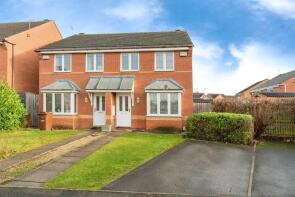
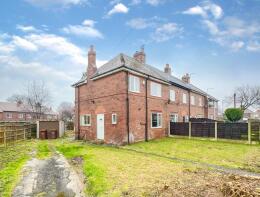
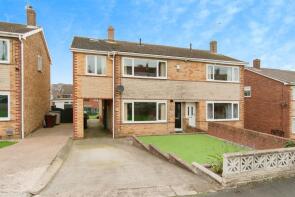
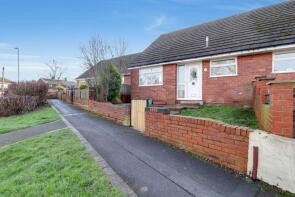
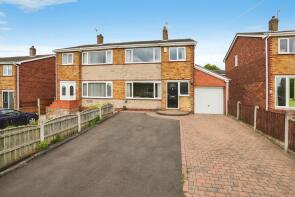
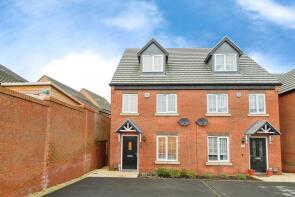
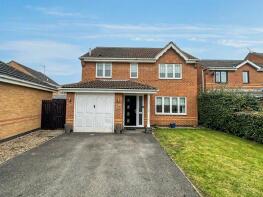
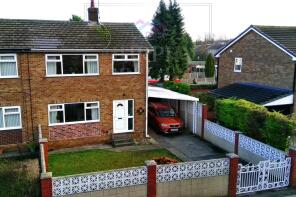
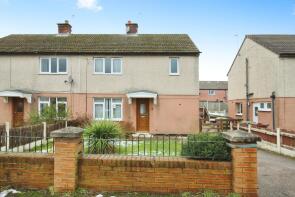
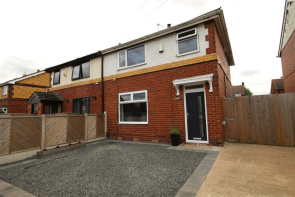
The majority of properties sold in Nevison during the last year were semi-detached properties, selling for an average price of £179,074. Detached properties sold for an average of £304,633, with terraced properties fetching £171,000.
Overall, the historical sold prices in Nevison over the last year were 8% up on the previous year and 10% up on the 2022 peak of £183,885.
Properties Sold
9, Crest Drive, Pontefract WF8 2RA
| Today | See what it's worth now |
| 19 Jun 2025 | £75,000 |
| 13 Jan 2009 | £95,000 |
No other historical records.
83, Cromwell Crescent, Pontefract WF8 2EJ
| Today | See what it's worth now |
| 30 May 2025 | £176,000 |
No other historical records.
120, Pontefract Road, Pontefract WF8 2PP
| Today | See what it's worth now |
| 30 May 2025 | £220,000 |
| 12 Jan 2001 | £66,500 |
No other historical records.
15, The Courtyard, Pontefract WF8 2UY
| Today | See what it's worth now |
| 23 May 2025 | £208,000 |
| 18 Jul 2022 | £185,000 |
103, Willow Park, Pontefract WF8 2SY
| Today | See what it's worth now |
| 20 May 2025 | £136,000 |
No other historical records.
2, Harewood Rise, Pontefract WF8 2UE
| Today | See what it's worth now |
| 19 May 2025 | £130,000 |
| 11 Dec 2017 | £85,000 |
18, Wiston Drive, Pontefract WF8 2UX
| Today | See what it's worth now |
| 12 May 2025 | £200,000 |
| 22 Jun 2001 | £63,750 |
No other historical records.
216, Willow Park, Pontefract WF8 2SX
| Today | See what it's worth now |
| 9 May 2025 | £125,000 |
No other historical records.
4, Scawthorpe Close, Pontefract WF8 2HT
| Today | See what it's worth now |
| 30 Apr 2025 | £230,000 |
No other historical records.
15, Rowan Green, Pontefract WF8 2DZ
| Today | See what it's worth now |
| 14 Apr 2025 | £157,000 |
| 6 Dec 2022 | £140,000 |
19, Scawthorpe Close, Pontefract WF8 2HT
| Today | See what it's worth now |
| 11 Apr 2025 | £210,000 |
| 24 Aug 2007 | £142,000 |
3, Glen Road, Pontefract WF8 2GP
| Today | See what it's worth now |
| 31 Mar 2025 | £247,000 |
| 22 Dec 2021 | £226,995 |
No other historical records.
22, Goodwood Road, Pontefract WF8 2GA
| Today | See what it's worth now |
| 31 Mar 2025 | £375,000 |
| 24 Nov 2014 | £203,000 |
No other historical records.
30, Northfield Drive, Pontefract WF8 2DJ
| Today | See what it's worth now |
| 28 Mar 2025 | £180,000 |
| 28 Jul 2017 | £116,000 |
45, Friarwood Avenue, Pontefract WF8 1AY
| Today | See what it's worth now |
| 28 Mar 2025 | £215,000 |
| 20 Dec 2018 | £152,950 |
No other historical records.
6, Stumpcross Court, Pontefract WF8 2DG
| Today | See what it's worth now |
| 27 Mar 2025 | £230,000 |
| 5 Oct 2012 | £160,000 |
15, Cavendish Avenue, Pontefract WF8 2UU
| Today | See what it's worth now |
| 25 Mar 2025 | £320,000 |
| 25 Aug 2000 | £84,995 |
No other historical records.
21, Water Lane, Pontefract WF8 2JX
| Today | See what it's worth now |
| 24 Mar 2025 | £211,000 |
| 28 Jan 2022 | £160,000 |
No other historical records.
6, Holmfield Close, Pontefract WF8 2NA
| Today | See what it's worth now |
| 18 Mar 2025 | £135,000 |
| 29 Jan 2010 | £56,000 |
No other historical records.
110, Churchbalk Lane, Pontefract WF8 2QW
| Today | See what it's worth now |
| 14 Mar 2025 | £199,950 |
| 30 Aug 2019 | £125,000 |
No other historical records.
95a, Pontefract Road, Pontefract WF8 2PU
| Today | See what it's worth now |
| 14 Mar 2025 | £325,000 |
No other historical records.
6, Harefield Road, Pontefract WF8 2HX
| Today | See what it's worth now |
| 12 Mar 2025 | £185,000 |
| 5 Oct 2018 | £125,000 |
3, Ashdene Grove, Pontefract WF8 2PW
| Today | See what it's worth now |
| 10 Mar 2025 | £182,500 |
| 28 Feb 2020 | £167,000 |
No other historical records.
12, Dandy Mill Avenue, Pontefract WF8 2JY
| Today | See what it's worth now |
| 7 Mar 2025 | £200,000 |
| 16 Apr 2021 | £145,000 |
93, Rookhill Road, Pontefract WF8 2DA
| Today | See what it's worth now |
| 7 Mar 2025 | £175,000 |
| 31 Jan 2020 | £118,000 |
No other historical records.
Get ready with a Mortgage in Principle
- Personalised result in just 20 minutes
- Find out how much you can borrow
- Get viewings faster with agents
- No impact on your credit score
What's your property worth?
Source Acknowledgement: © Crown copyright. England and Wales house price data is publicly available information produced by the HM Land Registry.This material was last updated on 6 August 2025. It covers the period from 1 January 1995 to 30 June 2025 and contains property transactions which have been registered during that period. Contains HM Land Registry data © Crown copyright and database right 2025. This data is licensed under the Open Government Licence v3.0.
Disclaimer: Rightmove.co.uk provides this HM Land Registry data "as is". The burden for fitness of the data relies completely with the user and is provided for informational purposes only. No warranty, express or implied, is given relating to the accuracy of content of the HM Land Registry data and Rightmove does not accept any liability for error or omission. If you have found an error with the data or need further information please contact HM Land Registry.
Permitted Use: Viewers of this Information are granted permission to access this Crown copyright material and to download it onto electronic, magnetic, optical or similar storage media provided that such activities are for private research, study or in-house use only. Any other use of the material requires the formal written permission of Land Registry which can be requested from us, and is subject to an additional licence and associated charge.
Map data ©OpenStreetMap contributors.
Rightmove takes no liability for your use of, or reliance on, Rightmove's Instant Valuation due to the limitations of our tracking tool listed here. Use of this tool is taken entirely at your own risk. All rights reserved.