
House Prices in New Marford
House prices in New Marford have an overall average of £692,185 over the last year.
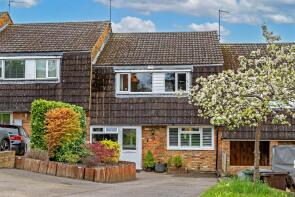
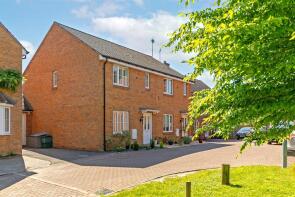
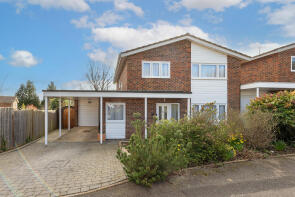
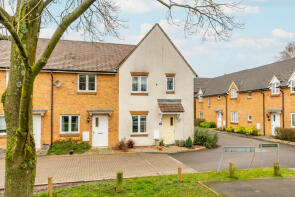
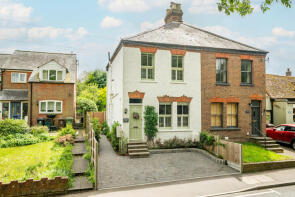
The majority of properties sold in New Marford during the last year were semi-detached properties, selling for an average price of £673,677. Detached properties sold for an average of £1,019,727, with terraced properties fetching £589,455.
Overall, the historical sold prices in New Marford over the last year were 5% down on the previous year and 17% down on the 2022 peak of £833,504.
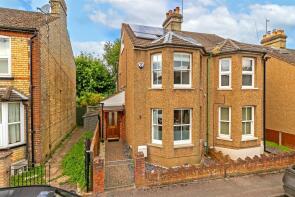
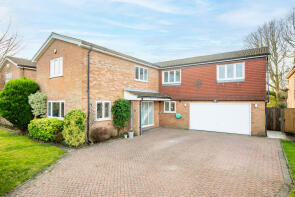
Properties Sold
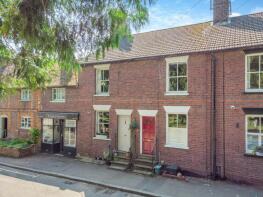
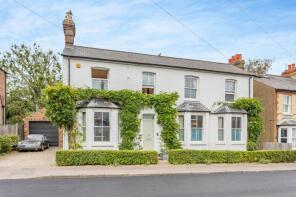
2, Church View, Church Street, St. Albans AL4 8AP
| Today | See what it's worth now |
| 21 Mar 2025 | £475,000 |
| 30 Nov 2018 | £345,000 |
No other historical records.
2a, Lattimore Road, St. Albans AL4 8QE
| Today | See what it's worth now |
| 5 Mar 2025 | £565,000 |
| 22 Feb 2019 | £487,500 |
41, Old School Drive, St. Albans AL4 8FH
| Today | See what it's worth now |
| 25 Feb 2025 | £600,000 |
| 26 Jun 2017 | £475,000 |
7, Smallwood Close, St. Albans AL4 8TW
| Today | See what it's worth now |
| 14 Feb 2025 | £243,000 |
| 15 Dec 2006 | £127,000 |
9, Granary Close, St. Albans AL4 8BA
| Today | See what it's worth now |
| 7 Feb 2025 | £600,000 |
| 1 Sep 2017 | £516,000 |
20, Smallwood Close, Wheathampstead AL4 8TW
| Today | See what it's worth now |
| 7 Feb 2025 | £440,000 |
No other historical records.
27, Brewhouse Hill, St. Albans AL4 8AN
| Today | See what it's worth now |
| 30 Jan 2025 | £557,500 |
| 6 Oct 2017 | £482,000 |
49, Nurseries Road, St. Albans AL4 8TP
| Today | See what it's worth now |
| 16 Dec 2024 | £120,000 |
| 5 Jun 1998 | £53,000 |
No other historical records.
9, Folly Fields, St. Albans AL4 8HJ
| Today | See what it's worth now |
| 12 Dec 2024 | £517,000 |
| 14 Nov 2014 | £375,000 |
No other historical records.
37, Four Limes, St. Albans AL4 8JN
| Today | See what it's worth now |
| 12 Dec 2024 | £160,000 |
| 8 Dec 2015 | £185,000 |
Hillside, Marshalls Heath Lane, St. Albans AL4 8HS
| Today | See what it's worth now |
| 10 Dec 2024 | £690,000 |
| 20 Dec 2021 | £595,000 |
No other historical records.
46, Old School Drive, St. Albans AL4 8FH
| Today | See what it's worth now |
| 6 Dec 2024 | £645,000 |
| 16 Dec 2016 | £565,000 |
1, High Meads, St. Albans AL4 8DN
| Today | See what it's worth now |
| 28 Nov 2024 | £950,000 |
| 29 Nov 1996 | £185,000 |
No other historical records.
29, Old School Drive, St. Albans AL4 8FH
| Today | See what it's worth now |
| 27 Nov 2024 | £500,000 |
| 15 Jun 2017 | £435,000 |
No other historical records.
North View, Church Street, St. Albans AL4 8AW
| Today | See what it's worth now |
| 22 Nov 2024 | £750,000 |
| 25 Sep 2015 | £487,500 |
20, King Edward Place, St. Albans AL4 8FJ
| Today | See what it's worth now |
| 15 Nov 2024 | £710,000 |
| 18 Jul 2007 | £555,000 |
No other historical records.
5, St Thomas Place, St. Albans AL4 8BG
| Today | See what it's worth now |
| 7 Nov 2024 | £1,000,000 |
| 20 Jan 2015 | £820,000 |
81, Caesars Road, St. Albans AL4 8PA
| Today | See what it's worth now |
| 6 Nov 2024 | £480,000 |
| 5 Apr 2000 | £159,950 |
No other historical records.
39, Butterfield Road, Wheathampstead AL4 8PX
| Today | See what it's worth now |
| 4 Nov 2024 | £577,500 |
No other historical records.
65, The Hill, St. Albans AL4 8PR


| Today | See what it's worth now |
| 29 Oct 2024 | £1,150,000 |
No other historical records.
20, Gustard Wood, St. Albans AL4 8RP
| Today | See what it's worth now |
| 25 Oct 2024 | £530,000 |
| 3 May 2018 | £470,500 |
52, Necton Road, St. Albans AL4 8AU
| Today | See what it's worth now |
| 8 Oct 2024 | £1,250,000 |
| 11 Aug 2009 | £374,500 |
No other historical records.
23, Folly Fields, Wheathampstead AL4 8HJ
| Today | See what it's worth now |
| 27 Sep 2024 | £447,750 |
No other historical records.
33, Necton Road, St. Albans AL4 8AT
| Today | See what it's worth now |
| 27 Sep 2024 | £545,500 |
| 8 Oct 2020 | £520,000 |
6, Beech Way, St. Albans AL4 8LY
| Today | See what it's worth now |
| 24 Sep 2024 | £1,200,000 |
| 9 Oct 2020 | £935,000 |
No other historical records.
Get ready with a Mortgage in Principle
- Personalised result in just 20 minutes
- Find out how much you can borrow
- Get viewings faster with agents
- No impact on your credit score
What's your property worth?
Source Acknowledgement: © Crown copyright. England and Wales house price data is publicly available information produced by the HM Land Registry.This material was last updated on 11 June 2025. It covers the period from 1 January 1995 to 31 March 2025 and contains property transactions which have been registered during that period. Contains HM Land Registry data © Crown copyright and database right 2025. This data is licensed under the Open Government Licence v3.0.
Disclaimer: Rightmove.co.uk provides this HM Land Registry data "as is". The burden for fitness of the data relies completely with the user and is provided for informational purposes only. No warranty, express or implied, is given relating to the accuracy of content of the HM Land Registry data and Rightmove does not accept any liability for error or omission. If you have found an error with the data or need further information please contact HM Land Registry.
Permitted Use: Viewers of this Information are granted permission to access this Crown copyright material and to download it onto electronic, magnetic, optical or similar storage media provided that such activities are for private research, study or in-house use only. Any other use of the material requires the formal written permission of Land Registry which can be requested from us, and is subject to an additional licence and associated charge.
Map data ©OpenStreetMap contributors.
Rightmove takes no liability for your use of, or reliance on, Rightmove's Instant Valuation due to the limitations of our tracking tool listed here. Use of this tool is taken entirely at your own risk. All rights reserved.