
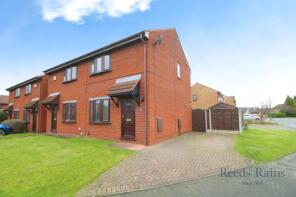
House Prices in Northwich
House prices in Northwich have an overall average of £258,814 over the last year.
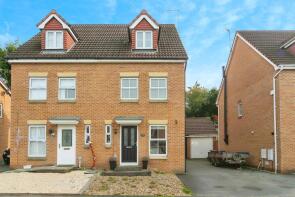
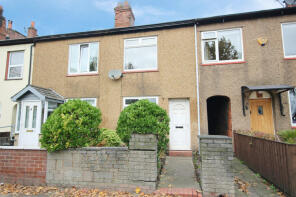
The majority of properties sold in Northwich during the last year were semi-detached properties, selling for an average price of £244,621. Terraced properties sold for an average of £174,767, with detached properties fetching £426,314.
Overall, the historical sold prices in Northwich over the last year were 1% down on the previous year and 2% down on the 2022 peak of £263,460.
Properties Sold
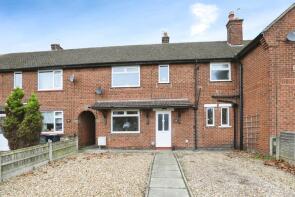
1, Lune Crescent, Northwich CW9 7NY
| Today | See what it's worth now |
| 27 Jun 2025 | £350,000 |
| 8 Feb 2022 | £365,995 |
No other historical records.
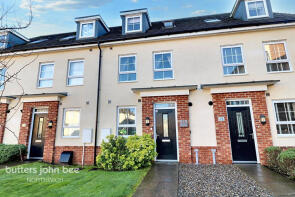
1, Audlem Drive, Northwich CW9 8SE

| Today | See what it's worth now |
| 23 Jun 2025 | £185,000 |
| 3 Nov 2006 | £124,950 |
111, London Road, Northwich CW9 8AT

| Today | See what it's worth now |
| 20 Jun 2025 | £222,500 |
| 6 Feb 1995 | £56,384 |
No other historical records.
20, Telford Road, Northwich CW8 4YN
| Today | See what it's worth now |
| 20 Jun 2025 | £255,000 |
| 25 May 2018 | £194,995 |
No other historical records.
Rose Farm, Church Street, Wincham, Northwich CW9 6EP
| Today | See what it's worth now |
| 13 Jun 2025 | £640,000 |
| 7 Dec 2016 | £450,000 |
No other historical records.
46, Townbridge Court, Castle Street, Northwich CW8 1BG
| Today | See what it's worth now |
| 6 Jun 2025 | £150,000 |
| 31 May 2024 | £100,000 |
3a, Bollington Avenue, Northwich CW9 8SB
| Today | See what it's worth now |
| 6 Jun 2025 | £185,000 |
| 20 Jan 2017 | £129,000 |
50, Bond Street, Northwich CW8 4DG
| Today | See what it's worth now |
| 6 Jun 2025 | £20,000 |
| 19 Sep 2003 | £86,500 |
No other historical records.
29, Gordale Close, Northwich CW8 4XT
| Today | See what it's worth now |
| 5 Jun 2025 | £250,000 |
| 9 Jun 2021 | £220,000 |
27, Manchester Road, Northwich CW9 5LY
| Today | See what it's worth now |
| 5 Jun 2025 | £135,000 |
| 24 May 2002 | £46,000 |
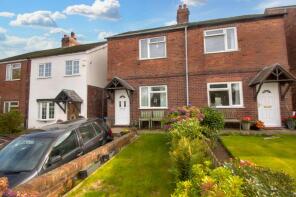
53, Grange Road, Barnton, Northwich CW8 4PE
| Today | See what it's worth now |
| 4 Jun 2025 | £175,000 |
| 8 Feb 2008 | £125,000 |
No other historical records.
30, Audlem Drive, Northwich CW9 8SE

| Today | See what it's worth now |
| 3 Jun 2025 | £192,000 |
| 8 Oct 2018 | £147,500 |
21, Bellevue Street, Winnington, Northwich CW8 4GL
| Today | See what it's worth now |
| 2 Jun 2025 | £265,000 |
| 29 Nov 2018 | £223,995 |
No other historical records.
56, Church Street, Wincham, Northwich CW9 6EP
| Today | See what it's worth now |
| 30 May 2025 | £210,000 |
| 8 May 1998 | £52,500 |
No other historical records.
36, Solvay Road, Northwich CW8 4DR

| Today | See what it's worth now |
| 30 May 2025 | £120,500 |
| 5 Jul 2010 | £87,500 |
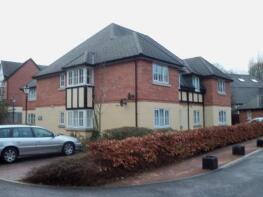
2, Weaver House, Marine Approach, Northwich CW8 1GD
| Today | See what it's worth now |
| 30 May 2025 | £150,000 |
| 30 Jun 2021 | £138,000 |
The Church House, St Andrews Court, Church Street, Wincham, Northwich CW9 6EP
| Today | See what it's worth now |
| 30 May 2025 | £580,000 |
| 31 Jul 2003 | £312,220 |
No other historical records.
6, Waterloo House, Marine Approach, Northwich CW8 1GH
| Today | See what it's worth now |
| 30 May 2025 | £132,000 |
| 5 Mar 2004 | £139,950 |
No other historical records.
4, Medlock Street, Northwich CW9 7HW
| Today | See what it's worth now |
| 30 May 2025 | £291,000 |
| 26 Nov 2021 | £267,495 |
No other historical records.
5, Park Street, Northwich CW8 1HQ
| Today | See what it's worth now |
| 27 May 2025 | £135,000 |
| 29 Mar 2016 | £89,000 |
22, Dunham Road, Northwich CW9 8EL
| Today | See what it's worth now |
| 23 May 2025 | £178,000 |
| 25 Jun 2021 | £152,000 |
No other historical records.
19, Freshwater View, Northwich CW8 1GL
| Today | See what it's worth now |
| 23 May 2025 | £280,000 |
| 3 May 2024 | £260,000 |
No other historical records.
3, Laburnum Road, Rudheath, Northwich CW9 7JT

| Today | See what it's worth now |
| 23 May 2025 | £175,000 |
| 25 Oct 2019 | £146,000 |
17, Woodlea Court, Northwich CW8 4TG
| Today | See what it's worth now |
| 23 May 2025 | £190,000 |
| 28 Nov 2018 | £150,500 |
31, Alvanley Rise, Northwich CW9 8AY
| Today | See what it's worth now |
| 23 May 2025 | £357,500 |
| 12 Sep 2002 | £139,000 |
Get ready with a Mortgage in Principle
- Personalised result in just 20 minutes
- Find out how much you can borrow
- Get viewings faster with agents
- No impact on your credit score
What's your property worth?
Source Acknowledgement: © Crown copyright. England and Wales house price data is publicly available information produced by the HM Land Registry.This material was last updated on 6 August 2025. It covers the period from 1 January 1995 to 30 June 2025 and contains property transactions which have been registered during that period. Contains HM Land Registry data © Crown copyright and database right 2025. This data is licensed under the Open Government Licence v3.0.
Disclaimer: Rightmove.co.uk provides this HM Land Registry data "as is". The burden for fitness of the data relies completely with the user and is provided for informational purposes only. No warranty, express or implied, is given relating to the accuracy of content of the HM Land Registry data and Rightmove does not accept any liability for error or omission. If you have found an error with the data or need further information please contact HM Land Registry.
Permitted Use: Viewers of this Information are granted permission to access this Crown copyright material and to download it onto electronic, magnetic, optical or similar storage media provided that such activities are for private research, study or in-house use only. Any other use of the material requires the formal written permission of Land Registry which can be requested from us, and is subject to an additional licence and associated charge.
Map data ©OpenStreetMap contributors.
Rightmove takes no liability for your use of, or reliance on, Rightmove's Instant Valuation due to the limitations of our tracking tool listed here. Use of this tool is taken entirely at your own risk. All rights reserved.