
House Prices in Oxenrig
House prices in Oxenrig have an overall average of £226,562 over the last year.
The majority of properties sold in Oxenrig during the last year were detached properties, selling for an average price of £329,300. Semi-detached properties sold for an average of £195,694, with terraced properties fetching £185,917.
Overall, the historical sold prices in Oxenrig over the last year were 4% up on the previous year and similar to the 2022 peak of £227,272.
Properties Sold
98, High Street, Coldstream TD12 4AG
| Today | See what it's worth now |
| 26 May 2025 | £90,000 |
| 31 May 2021 | £75,000 |
32, Duke Street, Coldstream TD12 4BS
| Today | See what it's worth now |
| 20 May 2025 | £126,000 |
No other historical records.
13, Bennecourt Crescent, Coldstream TD12 4BX
| Today | See what it's worth now |
| 19 May 2025 | £320,000 |
| 19 Apr 2016 | £202,500 |
10, Duke Street, Coldstream TD12 4BW
| Today | See what it's worth now |
| 8 May 2025 | £247,000 |
| 3 Sep 2014 | £166,000 |
Garden Cottage, Lees Stables, Kelso Road, Coldstream TD12 4LF
| Today | See what it's worth now |
| 2 May 2025 | £370,000 |
No other historical records.
The Shaws, Main Street, Leitholm TD12 4JN
| Today | See what it's worth now |
| 1 May 2025 | £352,500 |
| 4 Aug 2017 | £245,000 |
Flat 13, Old Seed Mill, Church Lane, Coldstream TD12 4DG
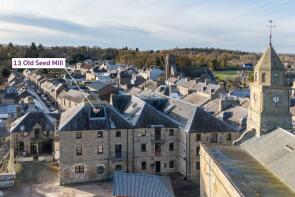
| Today | See what it's worth now |
| 31 Mar 2025 | £90,000 |
| 2 Dec 2019 | £62,000 |
No other historical records.
Cherrybank, Coldstream TD12 4LY
| Today | See what it's worth now |
| 28 Mar 2025 | £545,000 |
No other historical records.
Well House, Main Street, Coldstream TD12 4JL
| Today | See what it's worth now |
| 18 Mar 2025 | £280,000 |
| 11 Mar 2003 | £155,000 |
No other historical records.
8, Sunnyside, Donaldsons Lodge, Cornhill-on-tweed TD12 4XN
| Today | See what it's worth now |
| 11 Mar 2025 | £142,000 |
| 21 Sep 2012 | £80,000 |
35a, Duke Street, Coldstream TD12 4BS
| Today | See what it's worth now |
| 10 Mar 2025 | £107,500 |
| 4 Nov 2020 | £63,500 |
23, Leet Street, Coldstream TD12 4BJ
| Today | See what it's worth now |
| 5 Mar 2025 | £92,000 |
| 27 Jun 2022 | £77,100 |
26, Dunglass Road, Coldstream TD12 4FD
| Today | See what it's worth now |
| 5 Mar 2025 | £274,500 |
| 1 Jul 2022 | £265,000 |
No other historical records.
2a Horseshoe Cottage, Duke Street, Coldstream TD12 4BW
| Today | See what it's worth now |
| 24 Feb 2025 | £140,000 |
| 28 Mar 2022 | £117,000 |
Tweedbank Cottage, Wark TD12 4RH


| Today | See what it's worth now |
| 21 Feb 2025 | £255,000 |
No other historical records.
21, Hillview, Coldstream TD12 4ED

| Today | See what it's worth now |
| 10 Feb 2025 | £140,000 |
| 16 Jan 2012 | £30,229 |
No other historical records.
9, Hirsel View, Coldstream TD12 4BZ
| Today | See what it's worth now |
| 4 Feb 2025 | £260,000 |
| 9 May 2018 | £90,000 |
56, Lennel Mount, Coldstream TD12 4NS
| Today | See what it's worth now |
| 24 Jan 2025 | £185,000 |
No other historical records.
6, Victoria Street, Coldstream TD12 4AD
| Today | See what it's worth now |
| 20 Jan 2025 | £97,000 |
| 12 Jan 2015 | £300,020 |
18, Priory Bank, Coldstream TD12 4EA
| Today | See what it's worth now |
| 18 Dec 2024 | £152,750 |
| 18 Oct 2007 | £44,650 |
No other historical records.
14, Lennel Mount, Coldstream TD12 4NS
| Today | See what it's worth now |
| 16 Dec 2024 | £160,000 |
| 22 Sep 2014 | £130,000 |
No other historical records.
14, Spa Well Drive, Coldstream TD12 4DB
| Today | See what it's worth now |
| 2 Dec 2024 | £265,000 |
| 11 Apr 2003 | £113,000 |
No other historical records.
South View, Knowe Head, Cornhill-on-tweed TD12 4UQ

| Today | See what it's worth now |
| 27 Nov 2024 | £315,000 |
| 2 Sep 2020 | £242,000 |
Flat 8, Old Seed Mill, Church Lane, Coldstream TD12 4DG
| Today | See what it's worth now |
| 18 Nov 2024 | £79,500 |
| 19 Nov 2020 | £47,000 |
10, Cospatrick Court, Coldstream TD12 4EL
| Today | See what it's worth now |
| 1 Nov 2024 | £248,000 |
| 29 Jul 2019 | £187,000 |
Get ready with a Mortgage in Principle
- Personalised result in just 20 minutes
- Find out how much you can borrow
- Get viewings faster with agents
- No impact on your credit score
What's your property worth?
Source Acknowledgement: © Crown copyright. England and Wales house price data is publicly available information produced by the HM Land Registry.This material was last updated on 6 August 2025. It covers the period from 1 January 1995 to 30 June 2025 and contains property transactions which have been registered during that period. Contains HM Land Registry data © Crown copyright and database right 2025. This data is licensed under the Open Government Licence v3.0.
Disclaimer: Rightmove.co.uk provides this HM Land Registry data "as is". The burden for fitness of the data relies completely with the user and is provided for informational purposes only. No warranty, express or implied, is given relating to the accuracy of content of the HM Land Registry data and Rightmove does not accept any liability for error or omission. If you have found an error with the data or need further information please contact HM Land Registry.
Permitted Use: Viewers of this Information are granted permission to access this Crown copyright material and to download it onto electronic, magnetic, optical or similar storage media provided that such activities are for private research, study or in-house use only. Any other use of the material requires the formal written permission of Land Registry which can be requested from us, and is subject to an additional licence and associated charge.
Source Acknowledgement: © Crown copyright. Scottish house price data is publicly available information produced by the Registers of Scotland. Material has been reproduced with the permission of the Keeper of the Registers of Scotland and contains data compiled by Registers of Scotland. For further information, please contact data@ros.gov.uk. Please note the dates shown here relate to the property's registered date not sold date.This material was last updated on 7 August 2025. It covers the period from 8 December 1987 to 30 June 2025 and contains property transactions which have been registered during that period.
Disclaimer: Rightmove.co.uk provides this Registers of Scotland data "as is". The burden for fitness of the data relies completely with the user and is provided for informational purposes only. No warranty, express or implied, is given relating to the accuracy of content of the Registers of Scotland data and Rightmove plc does not accept any liability for error or omission. If you have found an error with the data or need further information please contact data@ros.gov.uk
Permitted Use: The Registers of Scotland allows the reproduction of the data which it provides to Rightmove.co.uk free of charge in any format or medium only for research, private study or for internal circulation within an organisation. This is subject to it being reproduced accurately and not used in a misleading context. The material must be acknowledged as Crown Copyright. You are not allowed to use this information for commercial purposes, nor must you copy, distribute, sell or publish the data in any way. For any other use of this material, please apply to the Registers of Scotland for a licence. You can do this online at www.ros.gov.uk, by email at data@ros.gov.uk or by writing to Business Development, Registers of Scotland, Meadowbank House, 153 London Road, Edinburgh EH8 7AU.
Map data ©OpenStreetMap contributors.
Rightmove takes no liability for your use of, or reliance on, Rightmove's Instant Valuation due to the limitations of our tracking tool listed here. Use of this tool is taken entirely at your own risk. All rights reserved.