
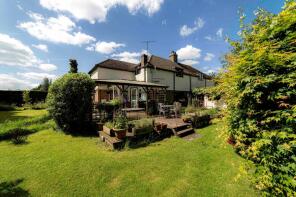
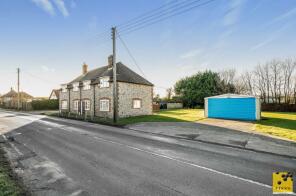
House Prices in Petham
House prices in Petham have an overall average of £468,333 over the last year.
The majority of properties sold in Petham during the last year were semi-detached properties, selling for an average price of £410,800. Detached properties sold for an average of £756,000.
Overall, the historical sold prices in Petham over the last year were 22% down on the previous year and 51% down on the 2019 peak of £957,798.
Properties Sold
1, Dane Chantry Cottages, Stone Street, Petham CT4 5PP
| Today | See what it's worth now |
| 18 Dec 2024 | £506,000 |
No other historical records.
1, Holly Tree Cottages, Stone Street, Canterbury CT4 5PR

| Today | See what it's worth now |
| 29 Oct 2024 | £370,000 |
| 21 Dec 2021 | £355,000 |
No other historical records.
Woodlands, Stone Street, Petham CT4 5PR
| Today | See what it's worth now |
| 2 Sep 2024 | £328,000 |
No other historical records.
The Granary, Limetree Farm, Stone Street, Petham CT4 5PW
| Today | See what it's worth now |
| 18 Jul 2024 | £495,000 |
| 19 Dec 2002 | £267,500 |
Deal House, Court Lodge Barns, Church Lane, Canterbury CT4 5RD

| Today | See what it's worth now |
| 17 Jul 2024 | £756,000 |
| 12 May 2021 | £750,000 |
No other historical records.
Homeland, Stone Street, Petham CT4 5PR


| Today | See what it's worth now |
| 9 Jul 2024 | £355,000 |
No other historical records.
6, East Wootton Cottages, Garlinge Green Road, Canterbury CT4 5RH
| Today | See what it's worth now |
| 25 Apr 2024 | £565,000 |
| 14 Feb 2007 | £340,000 |
No other historical records.
China Court, Church Lane, Canterbury CT4 5RD
| Today | See what it's worth now |
| 20 Dec 2023 | £860,000 |
| 19 Jul 2018 | £650,000 |
No other historical records.
Mill House, Stone Street, Canterbury CT4 5PW
| Today | See what it's worth now |
| 17 Nov 2023 | £675,000 |
| 4 Jun 2013 | £395,000 |
Highbank, The Street, Petham CT4 5QZ
| Today | See what it's worth now |
| 13 Nov 2023 | £360,500 |
No other historical records.
4, Glebe Cottages, The Street, Canterbury CT4 5QU
| Today | See what it's worth now |
| 18 Aug 2023 | £400,000 |
| 31 Jul 2020 | £282,500 |
5, Vicarage Hill, Canterbury CT4 5RE
| Today | See what it's worth now |
| 16 Aug 2023 | £520,000 |
| 8 Dec 1997 | £93,000 |
No other historical records.
The Old Bake House, The Street, Canterbury CT4 5QY
| Today | See what it's worth now |
| 5 Jul 2023 | £800,000 |
| 20 Dec 2010 | £440,000 |
Lyon House, The Street, Canterbury CT4 5QY
| Today | See what it's worth now |
| 16 Mar 2023 | £820,000 |
No other historical records.
Sweet Auburn Cottage, Church Lane, Canterbury CT4 5RD
| Today | See what it's worth now |
| 4 Nov 2022 | £335,000 |
No other historical records.
Duke House, The Street, Canterbury CT4 5QY
| Today | See what it's worth now |
| 30 Sep 2022 | £850,000 |
| 15 Nov 2002 | £322,500 |
5, Town Road, Canterbury CT4 5QT
| Today | See what it's worth now |
| 28 Sep 2021 | £301,000 |
No other historical records.
1, Bank Cottages, The Street, Canterbury CT4 5QZ
| Today | See what it's worth now |
| 17 Sep 2021 | £325,000 |
| 7 Jun 2013 | £193,000 |
Smugglers Rest, Stone Street, Canterbury CT4 5PR

| Today | See what it's worth now |
| 17 Sep 2021 | £475,000 |
No other historical records.
6, Tillard Close, Canterbury CT4 5RA
| Today | See what it's worth now |
| 20 Aug 2021 | £150,000 |
No other historical records.
Woodview, Stone Street, Canterbury CT4 5PP
| Today | See what it's worth now |
| 30 Jul 2021 | £900,000 |
No other historical records.
Tallet, Court Lodge Barns, Church Lane, Canterbury CT4 5RD

| Today | See what it's worth now |
| 30 Jun 2021 | £862,500 |
| 30 Jun 2021 | £862,500 |
No other historical records.
Linhay, Court Lodge Barns, Church Lane, Canterbury CT4 5RD

| Today | See what it's worth now |
| 28 Jun 2021 | £675,000 |
No other historical records.
Longview, Court Lodge Barns, Church Lane, Canterbury CT4 5RD

| Today | See what it's worth now |
| 13 May 2021 | £975,000 |
No other historical records.
Hemmel, Court Lodge Barns, Church Lane, Canterbury CT4 5RD

| Today | See what it's worth now |
| 23 Apr 2021 | £915,950 |
No other historical records.
Get ready with a Mortgage in Principle
- Personalised result in just 20 minutes
- Find out how much you can borrow
- Get viewings faster with agents
- No impact on your credit score
What's your property worth?
Source Acknowledgement: © Crown copyright. England and Wales house price data is publicly available information produced by the HM Land Registry.This material was last updated on 11 June 2025. It covers the period from 1 January 1995 to 31 March 2025 and contains property transactions which have been registered during that period. Contains HM Land Registry data © Crown copyright and database right 2025. This data is licensed under the Open Government Licence v3.0.
Disclaimer: Rightmove.co.uk provides this HM Land Registry data "as is". The burden for fitness of the data relies completely with the user and is provided for informational purposes only. No warranty, express or implied, is given relating to the accuracy of content of the HM Land Registry data and Rightmove does not accept any liability for error or omission. If you have found an error with the data or need further information please contact HM Land Registry.
Permitted Use: Viewers of this Information are granted permission to access this Crown copyright material and to download it onto electronic, magnetic, optical or similar storage media provided that such activities are for private research, study or in-house use only. Any other use of the material requires the formal written permission of Land Registry which can be requested from us, and is subject to an additional licence and associated charge.
Map data ©OpenStreetMap contributors.
Rightmove takes no liability for your use of, or reliance on, Rightmove's Instant Valuation due to the limitations of our tracking tool listed here. Use of this tool is taken entirely at your own risk. All rights reserved.