
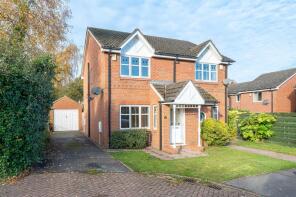
House Prices in Poppleton
House prices in Poppleton have an overall average of £488,015 over the last year.
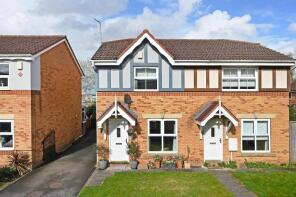
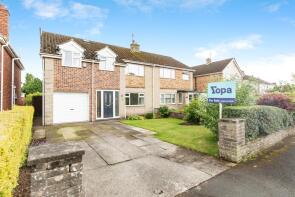
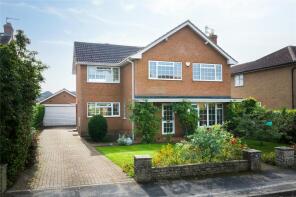
The majority of properties sold in Poppleton during the last year were detached properties, selling for an average price of £514,125. Semi-detached properties sold for an average of £456,958, with terraced properties fetching £327,498.
Overall, the historical sold prices in Poppleton over the last year were 2% up on the previous year and 7% up on the 2021 peak of £456,099.
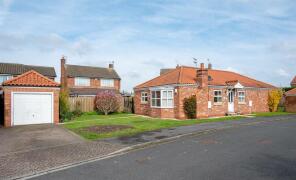
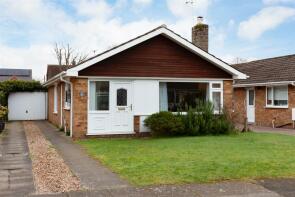
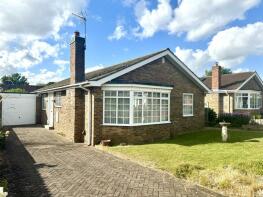
Properties Sold
15, Chantry Gap, Upper Poppleton, York YO26 6DG
| Today | See what it's worth now |
| 13 Jun 2025 | £350,000 |
| 20 Jun 2001 | £93,550 |
No other historical records.
11, Nursery Road, Nether Poppleton, York YO26 6NN

| Today | See what it's worth now |
| 5 Jun 2025 | £622,125 |
| 1 Aug 2007 | £249,000 |
9 Bowness, Lime Garth, Upper Poppleton, York YO26 6DN
| Today | See what it's worth now |
| 27 May 2025 | £417,500 |
| 7 Jan 2000 | £82,000 |
No other historical records.
Tree Tops, Nursery To Red Lion, Upper Poppleton, York YO26 6QB
| Today | See what it's worth now |
| 22 May 2025 | £927,500 |
| 8 Jan 2021 | £760,000 |
No other historical records.
3, Nursery Court, Nether Poppleton, York YO26 6LR
| Today | See what it's worth now |
| 19 May 2025 | £475,000 |
| 16 Dec 2022 | £465,000 |
No other historical records.
98, Millfield Lane, Nether Poppleton, York YO26 6PD
| Today | See what it's worth now |
| 28 Mar 2025 | £320,000 |
| 18 Nov 2022 | £339,995 |
No other historical records.
14, Orchard Road, Upper Poppleton, York YO26 6HF
| Today | See what it's worth now |
| 27 Mar 2025 | £525,000 |
| 12 Aug 2005 | £230,000 |
2, Millfield Lane, Nether Poppleton, York YO26 6HR
| Today | See what it's worth now |
| 20 Mar 2025 | £250,000 |
| 20 Aug 2020 | £200,000 |
14, Dikelands Lane, Upper Poppleton, York YO26 6JB
| Today | See what it's worth now |
| 11 Mar 2025 | £475,000 |
| 1 Sep 2004 | £269,950 |
16, Severn Green, Nether Poppleton, York YO26 6RJ
| Today | See what it's worth now |
| 7 Mar 2025 | £250,000 |
| 29 Apr 2003 | £119,000 |
21, Severn Green, Nether Poppleton, York YO26 6RE
| Today | See what it's worth now |
| 28 Feb 2025 | £268,000 |
| 11 Sep 2008 | £167,000 |
5, Nursery Road, Nether Poppleton, York YO26 6NN
| Today | See what it's worth now |
| 29 Jan 2025 | £560,000 |
No other historical records.
41, Hillcrest Avenue, Nether Poppleton, York YO26 6LD
| Today | See what it's worth now |
| 6 Jan 2025 | £610,000 |
| 10 Sep 2009 | £360,000 |
No other historical records.
1, Trophy Close, Upper Poppleton, York YO26 6SE


| Today | See what it's worth now |
| 29 Nov 2024 | £474,996 |
No other historical records.
24, Keepers Way, Upper Poppleton, York YO26 6SG

| Today | See what it's worth now |
| 29 Nov 2024 | £634,995 |
No other historical records.
4, Keepers Way, Upper Poppleton, York YO26 6SG

| Today | See what it's worth now |
| 29 Nov 2024 | £546,246 |
No other historical records.
2, Sycamore View, Upper Poppleton, York YO26 6LN
| Today | See what it's worth now |
| 21 Nov 2024 | £460,000 |
| 11 Dec 1996 | £115,000 |
No other historical records.
10, Keepers Way, Upper Poppleton, York YO26 6SG

| Today | See what it's worth now |
| 21 Nov 2024 | £604,995 |
No other historical records.
14, Keepers Way, Upper Poppleton, York YO26 6SG

| Today | See what it's worth now |
| 1 Nov 2024 | £584,995 |
No other historical records.
7, Champion Drive, Upper Poppleton, York YO26 6SB

| Today | See what it's worth now |
| 25 Oct 2024 | £334,995 |
No other historical records.
67, Nether Way, Nether Poppleton, York YO26 6HW
| Today | See what it's worth now |
| 24 Oct 2024 | £347,500 |
| 30 Jan 2015 | £220,000 |
No other historical records.
9, Littlefield Close, Nether Poppleton, York YO26 6HX
| Today | See what it's worth now |
| 18 Oct 2024 | £425,000 |
No other historical records.
2, Champion Drive, Upper Poppleton, York YO26 6SB

| Today | See what it's worth now |
| 14 Oct 2024 | £539,995 |
No other historical records.
12, Keepers Way, Upper Poppleton, York YO26 6SG

| Today | See what it's worth now |
| 4 Oct 2024 | £634,995 |
No other historical records.
Danby Cottage, Black Dykes Lane, Upper Poppleton, York YO26 6PT

| Today | See what it's worth now |
| 1 Oct 2024 | £255,000 |
| 9 Jun 2017 | £185,000 |
Get ready with a Mortgage in Principle
- Personalised result in just 20 minutes
- Find out how much you can borrow
- Get viewings faster with agents
- No impact on your credit score
What's your property worth?
Source Acknowledgement: © Crown copyright. England and Wales house price data is publicly available information produced by the HM Land Registry.This material was last updated on 6 August 2025. It covers the period from 1 January 1995 to 30 June 2025 and contains property transactions which have been registered during that period. Contains HM Land Registry data © Crown copyright and database right 2025. This data is licensed under the Open Government Licence v3.0.
Disclaimer: Rightmove.co.uk provides this HM Land Registry data "as is". The burden for fitness of the data relies completely with the user and is provided for informational purposes only. No warranty, express or implied, is given relating to the accuracy of content of the HM Land Registry data and Rightmove does not accept any liability for error or omission. If you have found an error with the data or need further information please contact HM Land Registry.
Permitted Use: Viewers of this Information are granted permission to access this Crown copyright material and to download it onto electronic, magnetic, optical or similar storage media provided that such activities are for private research, study or in-house use only. Any other use of the material requires the formal written permission of Land Registry which can be requested from us, and is subject to an additional licence and associated charge.
Map data ©OpenStreetMap contributors.
Rightmove takes no liability for your use of, or reliance on, Rightmove's Instant Valuation due to the limitations of our tracking tool listed here. Use of this tool is taken entirely at your own risk. All rights reserved.