
House Prices in Potterhanworth
House prices in Potterhanworth have an overall average of £365,857 over the last year.
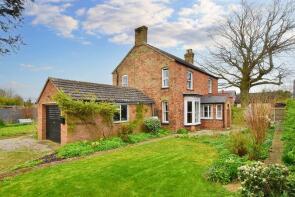
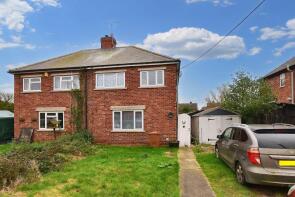
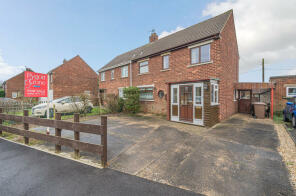
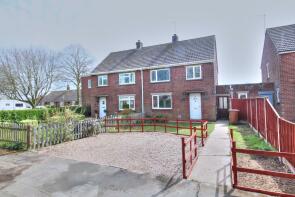
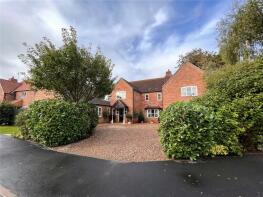
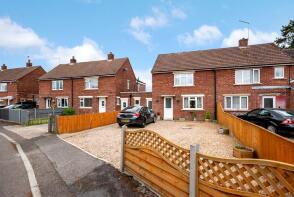
The majority of properties sold in Potterhanworth during the last year were detached properties, selling for an average price of £413,100. Semi-detached properties sold for an average of £247,750.
Overall, the historical sold prices in Potterhanworth over the last year were 35% up on the previous year and similar to the 2022 peak of £368,160.
Properties Sold
3, The Paddocks, Potterhanworth, Lincoln LN4 2FD


| Today | See what it's worth now |
| 19 Jun 2025 | £493,000 |
| 21 May 2020 | £300,000 |
Orchard House, Nocton Road, Potterhanworth, Lincoln LN4 2DN
| Today | See what it's worth now |
| 10 Jan 2025 | £580,000 |
| 26 Aug 2020 | £465,000 |
7, Woodlands Close, Potterhanworth, Lincoln LN4 2ED
| Today | See what it's worth now |
| 12 Dec 2024 | £425,000 |
| 14 Jan 2005 | £230,000 |
No other historical records.
2, Station Cottages, Station Road, Potterhanworth, Lincoln LN4 2DX
| Today | See what it's worth now |
| 18 Nov 2024 | £238,000 |
| 21 Jan 2022 | £235,000 |
7, The Park, Potterhanworth, Lincoln LN4 2EB
| Today | See what it's worth now |
| 30 Oct 2024 | £245,000 |
| 31 Oct 2014 | £175,000 |
The Moor House, Moor Lane, Potterhanworth, Lincoln LN4 2DZ
| Today | See what it's worth now |
| 13 Sep 2024 | £322,500 |
No other historical records.
Church View Cottage, The Green, Potterhanworth, Lincoln LN4 2DW
| Today | See what it's worth now |
| 4 Sep 2024 | £257,500 |
| 25 Sep 2020 | £220,000 |
The Sevenlands, Moor Lane, Potterhanworth, Lincoln LN4 2DZ
| Today | See what it's worth now |
| 16 Jul 2024 | £460,000 |
No other historical records.
20, Moor Lane, Potterhanworth, Lincoln LN4 2DZ
| Today | See what it's worth now |
| 8 Jul 2024 | £138,000 |
No other historical records.
2, South View Cottages, Barff Road, Potterhanworth, Lincoln LN4 2DU

| Today | See what it's worth now |
| 23 May 2024 | £200,000 |
| 22 Mar 2012 | £90,000 |
No other historical records.
1, White House Cottages, Main Road, Potterhanworth, Lincoln LN4 2DT
| Today | See what it's worth now |
| 26 Jan 2024 | £158,000 |
No other historical records.
Thyme Lodge, Barff Road, Potterhanworth, Lincoln LN4 2DU

| Today | See what it's worth now |
| 18 Dec 2023 | £340,000 |
| 14 Jan 2022 | £330,000 |
No other historical records.
Baytree House, Station Road, Potterhanworth, Lincoln LN4 2DX
| Today | See what it's worth now |
| 29 Sep 2023 | £355,000 |
No other historical records.
15, Rectory Close, Potterhanworth, Lincoln LN4 2EQ
| Today | See what it's worth now |
| 21 Sep 2023 | £265,000 |
| 17 Jul 2021 | £262,750 |
Rose Cottage, Barff Road, Potterhanworth, Lincoln LN4 2DU
| Today | See what it's worth now |
| 25 Aug 2023 | £248,000 |
No other historical records.
36, Queensway, Potterhanworth, Lincoln LN4 2EA
| Today | See what it's worth now |
| 28 Apr 2023 | £172,000 |
No other historical records.
Maori Gates, Barff Road, Potterhanworth, Lincoln LN4 2DU

| Today | See what it's worth now |
| 31 Mar 2023 | £200,000 |
| 21 Mar 2000 | £70,000 |
No other historical records.
Rowan Tree Cottage, Cross Street, Potterhanworth, Lincoln LN4 2DS

| Today | See what it's worth now |
| 10 Mar 2023 | £520,000 |
No other historical records.
Haven Cottage, Main Road, Potterhanworth, Lincoln LN4 2DT
| Today | See what it's worth now |
| 17 Feb 2023 | £260,000 |
| 25 Aug 2016 | £165,000 |
44, Queensway, Potterhanworth, Lincoln LN4 2EA

| Today | See what it's worth now |
| 20 Oct 2022 | £385,000 |
No other historical records.
Station House, Station Road, Potterhanworth, Lincoln LN4 2DX
| Today | See what it's worth now |
| 28 Sep 2022 | £315,000 |
No other historical records.
Newton, Main Road, Potterhanworth, Lincoln LN4 2DT
| Today | See what it's worth now |
| 12 Aug 2022 | £585,000 |
| 25 Aug 2017 | £395,000 |
No other historical records.
28, Queensway, Potterhanworth, Lincoln LN4 2EA
| Today | See what it's worth now |
| 5 Aug 2022 | £190,280 |
| 24 Mar 2011 | £110,000 |
30, The Park, Potterhanworth, Lincoln LN4 2EB
| Today | See what it's worth now |
| 25 Apr 2022 | £690,000 |
| 7 Nov 2001 | £163,500 |
No other historical records.
41, Queensway, Potterhanworth, Lincoln LN4 2EA
| Today | See what it's worth now |
| 25 Mar 2022 | £215,000 |
| 7 Apr 2017 | £142,500 |
Get ready with a Mortgage in Principle
- Personalised result in just 20 minutes
- Find out how much you can borrow
- Get viewings faster with agents
- No impact on your credit score
What's your property worth?
Source Acknowledgement: © Crown copyright. England and Wales house price data is publicly available information produced by the HM Land Registry.This material was last updated on 6 August 2025. It covers the period from 1 January 1995 to 30 June 2025 and contains property transactions which have been registered during that period. Contains HM Land Registry data © Crown copyright and database right 2025. This data is licensed under the Open Government Licence v3.0.
Disclaimer: Rightmove.co.uk provides this HM Land Registry data "as is". The burden for fitness of the data relies completely with the user and is provided for informational purposes only. No warranty, express or implied, is given relating to the accuracy of content of the HM Land Registry data and Rightmove does not accept any liability for error or omission. If you have found an error with the data or need further information please contact HM Land Registry.
Permitted Use: Viewers of this Information are granted permission to access this Crown copyright material and to download it onto electronic, magnetic, optical or similar storage media provided that such activities are for private research, study or in-house use only. Any other use of the material requires the formal written permission of Land Registry which can be requested from us, and is subject to an additional licence and associated charge.
Map data ©OpenStreetMap contributors.
Rightmove takes no liability for your use of, or reliance on, Rightmove's Instant Valuation due to the limitations of our tracking tool listed here. Use of this tool is taken entirely at your own risk. All rights reserved.