
House Prices in Pumpherston
House prices in Pumpherston have an overall average of £191,916 over the last year.
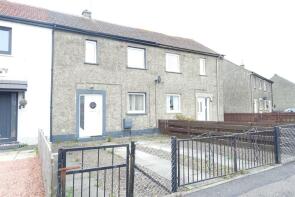
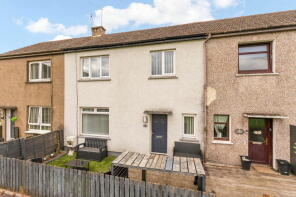
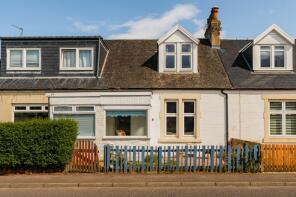
The majority of properties sold in Pumpherston during the last year were terraced properties, selling for an average price of £166,640. Semi-detached properties sold for an average of £193,413, with detached properties fetching £376,250.
Overall, the historical sold prices in Pumpherston over the last year were 5% up on the previous year and 8% down on the 2022 peak of £208,606.
Properties Sold
9, Heaney Avenue, Livingston EH53 0LJ

| Today | See what it's worth now |
| 26 Jun 2025 | £155,000 |
| 10 Sep 2018 | £129,500 |
21, Drumshoreland Road, Pumpherston EH53 0LF
| Today | See what it's worth now |
| 18 Jun 2025 | £187,000 |
No other historical records.
78, Uphall Station Road, Livingston EH53 0LW
| Today | See what it's worth now |
| 9 Jun 2025 | £273,500 |
| 24 Aug 2017 | £130,000 |
No other historical records.
1, Letham Terrace, Livingston EH53 0NE
| Today | See what it's worth now |
| 19 May 2025 | £175,000 |
| 25 Apr 2003 | £27,000 |
No other historical records.
17, Uphall Station Road, Livingston EH53 0LY
| Today | See what it's worth now |
| 13 May 2025 | £220,000 |
| 22 Jun 2022 | £192,500 |
No other historical records.
5, Letham Place, Livingston EH53 0NJ
| Today | See what it's worth now |
| 8 May 2025 | £138,000 |
| 1 Mar 2017 | £90,000 |
13, Harrysmuir Gardens, Livingston EH53 0PJ
| Today | See what it's worth now |
| 30 Apr 2025 | £180,000 |
| 24 Nov 2020 | £147,879 |
99, Harrysmuir Gardens, Livingston EH53 0PJ
| Today | See what it's worth now |
| 4 Apr 2025 | £225,000 |
| 9 Jun 2020 | £170,000 |
No other historical records.
41, Erskine Place, Uphall Station Road, Livingston EH53 0LU

| Today | See what it's worth now |
| 31 Mar 2025 | £432,500 |
| 10 Sep 2019 | £160,000 |
No other historical records.
25, Letham Road, Livingston EH53 0NR
| Today | See what it's worth now |
| 24 Mar 2025 | £162,500 |
| 24 Jun 2014 | £100,000 |
100, Uphall Station Road, Livingston EH53 0PQ
| Today | See what it's worth now |
| 29 Jan 2025 | £158,000 |
| 21 Jun 2016 | £42,800 |
No other historical records.
8, Letham Gardens, Livingston EH53 0NH
| Today | See what it's worth now |
| 23 Jan 2025 | £130,000 |
| 24 Dec 2001 | £15,500 |
No other historical records.
82, Uphall Station Road, Livingston EH53 0LW

| Today | See what it's worth now |
| 15 Jan 2025 | £320,000 |
| 31 Jul 2014 | £210,000 |
29, Harrysmuir Road, Livingston EH53 0NT
| Today | See what it's worth now |
| 7 Jan 2025 | �£255,777 |
| 4 Apr 2018 | £137,500 |
36, Heaney Avenue, Pumpherston EH53 0LL
| Today | See what it's worth now |
| 20 Dec 2024 | £142,000 |
No other historical records.
24, Letham Crescent, Livingston EH53 0NL
| Today | See what it's worth now |
| 12 Dec 2024 | £126,500 |
| 4 Oct 2007 | £70,000 |
No other historical records.
14, Letham Gardens, Livingston EH53 0NH
| Today | See what it's worth now |
| 6 Dec 2024 | £150,000 |
| 20 Apr 2021 | £133,000 |
64, Uphall Station Road, Livingston EH53 0LW
| Today | See what it's worth now |
| 28 Nov 2024 | £173,520 |
| 7 Jun 2022 | £164,300 |
36, Drumshoreland Road, Pumpherston EH53 0LH
| Today | See what it's worth now |
| 20 Nov 2024 | £238,000 |
No other historical records.
14, Letham Road, Pumpherston EH53 0NR


| Today | See what it's worth now |
| 30 Oct 2024 | £115,000 |
No other historical records.
46, Uphall Station Road, Livingston EH53 0LP
| Today | See what it's worth now |
| 20 Sep 2024 | £143,000 |
| 22 Nov 2006 | £85,000 |
2, Drumshoreland Place, Pumpherston EH53 0PE
| Today | See what it's worth now |
| 20 Sep 2024 | £180,612 |
No other historical records.
1, Harrysmuir Terrace, Livingston EH53 0NX
| Today | See what it's worth now |
| 20 Sep 2024 | £180,079 |
| 7 Apr 2015 | £71,000 |
No other historical records.
48, Heaney Avenue, Livingston EH53 0LL
| Today | See what it's worth now |
| 2 Aug 2024 | £145,000 |
No other historical records.
72, Harrysmuir Gardens, Livingston EH53 0PL
| Today | See what it's worth now |
| 30 Jul 2024 | £284,250 |
| 29 Mar 2021 | £250,000 |
Get ready with a Mortgage in Principle
- Personalised result in just 20 minutes
- Find out how much you can borrow
- Get viewings faster with agents
- No impact on your credit score
What's your property worth?
Source Acknowledgement: © Crown copyright. Scottish house price data is publicly available information produced by the Registers of Scotland. Material has been reproduced with the permission of the Keeper of the Registers of Scotland and contains data compiled by Registers of Scotland. For further information, please contact data@ros.gov.uk. Please note the dates shown here relate to the property's registered date not sold date.This material was last updated on 7 August 2025. It covers the period from 28 July 1995 to 30 June 2025 and contains property transactions which have been registered during that period.
Disclaimer: Rightmove.co.uk provides this Registers of Scotland data "as is". The burden for fitness of the data relies completely with the user and is provided for informational purposes only. No warranty, express or implied, is given relating to the accuracy of content of the Registers of Scotland data and Rightmove plc does not accept any liability for error or omission. If you have found an error with the data or need further information please contact data@ros.gov.uk
Permitted Use: The Registers of Scotland allows the reproduction of the data which it provides to Rightmove.co.uk free of charge in any format or medium only for research, private study or for internal circulation within an organisation. This is subject to it being reproduced accurately and not used in a misleading context. The material must be acknowledged as Crown Copyright. You are not allowed to use this information for commercial purposes, nor must you copy, distribute, sell or publish the data in any way. For any other use of this material, please apply to the Registers of Scotland for a licence. You can do this online at www.ros.gov.uk, by email at data@ros.gov.uk or by writing to Business Development, Registers of Scotland, Meadowbank House, 153 London Road, Edinburgh EH8 7AU.
Map data ©OpenStreetMap contributors.
Rightmove takes no liability for your use of, or reliance on, Rightmove's Instant Valuation due to the limitations of our tracking tool listed here. Use of this tool is taken entirely at your own risk. All rights reserved.