
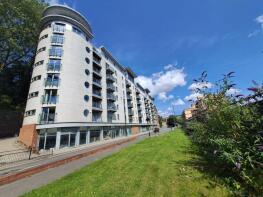
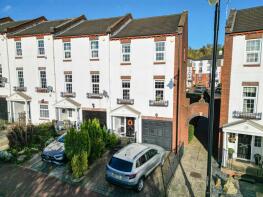
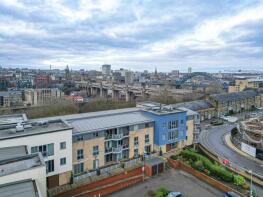
House Prices in Quayside
House prices in Quayside have an overall average of £203,448 over the last year.
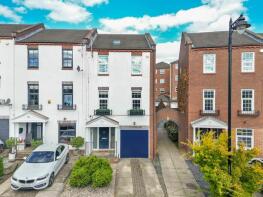
The majority of properties sold in Quayside during the last year were flats, selling for an average price of £186,890. Terraced properties sold for an average of £288,806, with semi-detached properties fetching £357,500.
Overall, the historical sold prices in Quayside over the last year were 9% up on the previous year and 9% up on the 2021 peak of £187,125.
Properties Sold
14, Midlothian Court, Worsdell Drive, Gateshead Central, Gateshead NE8 2FA

| Today | See what it's worth now |
| 13 Jun 2025 | £245,000 |
| 8 Aug 2014 | £194,995 |
No other historical records.
56, Bittern House, Worsdell Drive, Gateshead Central, Gateshead NE8 2FB

| Today | See what it's worth now |
| 13 Jun 2025 | £170,000 |
| 29 Aug 2023 | £175,000 |
Flat 8, Phoenix House Apartments, Queen Street, Newcastle Upon Tyne NE1 3UG
| Today | See what it's worth now |
| 2 Jun 2025 | £350,000 |
| 24 Jan 2011 | £305,000 |
5, Fairway Court, Fletcher Road, Gateshead Central, Gateshead NE8 2AY
| Today | See what it's worth now |
| 2 Jun 2025 | £150,000 |
| 15 Oct 2021 | £152,000 |
10, Tranquil House, Worsdell Drive, Gateshead Central, Gateshead NE8 2EU
| Today | See what it's worth now |
| 30 May 2025 | £170,000 |
| 13 Nov 2018 | £149,000 |
7, Rosalind Place, Newcastle Upon Tyne NE6 1LJ
| Today | See what it's worth now |
| 29 May 2025 | £268,000 |
| 6 Dec 2019 | £230,000 |
11, Fairway Court, Fletcher Road, Gateshead Central, Gateshead NE8 2AY
| Today | See what it's worth now |
| 23 May 2025 | £138,000 |
| 25 Aug 2016 | £165,000 |
23, Ouseburn Wharf, Saint Lawrence Road, Newcastle Upon Tyne NE6 1BY


| Today | See what it's worth now |
| 23 May 2025 | £131,000 |
| 23 Jan 2007 | £169,150 |
No other historical records.
16, Marmion Court, Worsdell Drive, Gateshead Central, Gateshead NE8 2EY
| Today | See what it's worth now |
| 20 May 2025 | £140,000 |
| 15 Sep 2017 | £145,000 |
45, Trigo House, Worsdell Drive, Gateshead Central, Gateshead NE8 2DA

| Today | See what it's worth now |
| 16 May 2025 | £175,000 |
| 23 Feb 2018 | £156,995 |
No other historical records.
Apartment 47, Manor Chare Apartments, Manor Chare, Newcastle Upon Tyne NE1 2EQ
| Today | See what it's worth now |
| 14 May 2025 | £200,000 |
| 12 Sep 2022 | £190,000 |
Apartment 9, Hanover Point, Clavering Place, Newcastle Upon Tyne NE1 3AT

| Today | See what it's worth now |
| 9 May 2025 | £830,000 |
No other historical records.
Apartment 25, Hanover Mill, Hanover Street, Newcastle Upon Tyne NE1 3AB
| Today | See what it's worth now |
| 2 May 2025 | £107,500 |
| 21 Apr 2008 | £170,000 |
No other historical records.
Apartment 81, Hanover Mill, Hanover Street, Newcastle Upon Tyne NE1 3AB
| Today | See what it's worth now |
| 25 Apr 2025 | £152,000 |
| 17 Oct 2018 | £145,000 |
16, Dobson Crescent, Newcastle Upon Tyne NE6 1TT
| Today | See what it's worth now |
| 15 Apr 2025 | £302,500 |
| 17 Nov 2017 | £215,000 |
Apartment 4, 62, Close, Newcastle Upon Tyne NE1 3RJ

| Today | See what it's worth now |
| 11 Apr 2025 | £165,000 |
| 17 Aug 2017 | £155,000 |
Apartment 33, Marconi House, Melbourne Street, Newcastle Upon Tyne NE1 2JS
| Today | See what it's worth now |
| 11 Apr 2025 | £150,000 |
| 3 Jul 2014 | £135,000 |
36, Midlothian Court, Worsdell Drive, Gateshead Central, Gateshead NE8 2FA
| Today | See what it's worth now |
| 10 Apr 2025 | £120,000 |
| 3 Dec 2014 | £119,995 |
No other historical records.
11, Dobson Crescent, Newcastle Upon Tyne NE6 1TT
| Today | See what it's worth now |
| 31 Mar 2025 | £258,000 |
| 11 Nov 2019 | £227,500 |
1, Peony Place, Newcastle Upon Tyne NE6 1LU
| Today | See what it's worth now |
| 31 Mar 2025 | £150,000 |
| 13 Jul 2020 | £133,000 |
39, Merchants Wharf, Newcastle Upon Tyne NE6 1TR
| Today | See what it's worth now |
| 27 Mar 2025 | £275,000 |
| 17 Jan 2020 | £175,000 |
No other historical records.
52, High Quay, City Road, Newcastle Upon Tyne NE1 2PD
| Today | See what it's worth now |
| 26 Mar 2025 | £265,000 |
| 24 Aug 2001 | £280,000 |
No other historical records.
37, High Quay, City Road, Newcastle Upon Tyne NE1 2PD

| Today | See what it's worth now |
| 18 Mar 2025 | £320,000 |
| 19 Jan 2018 | £297,500 |
15, Churchill Mews, Saint Peters Basin, Newcastle Upon Tyne NE6 1BH
| Today | See what it's worth now |
| 28 Feb 2025 | £210,000 |
| 21 Feb 2020 | £164,000 |
41, Fairway Court, Fletcher Road, Gateshead Central, Gateshead NE8 2AY
| Today | See what it's worth now |
| 25 Feb 2025 | £211,000 |
| 8 Jun 2016 | £205,000 |
Get ready with a Mortgage in Principle
- Personalised result in just 20 minutes
- Find out how much you can borrow
- Get viewings faster with agents
- No impact on your credit score
What's your property worth?
Source Acknowledgement: © Crown copyright. England and Wales house price data is publicly available information produced by the HM Land Registry.This material was last updated on 6 August 2025. It covers the period from 1 January 1995 to 30 June 2025 and contains property transactions which have been registered during that period. Contains HM Land Registry data © Crown copyright and database right 2025. This data is licensed under the Open Government Licence v3.0.
Disclaimer: Rightmove.co.uk provides this HM Land Registry data "as is". The burden for fitness of the data relies completely with the user and is provided for informational purposes only. No warranty, express or implied, is given relating to the accuracy of content of the HM Land Registry data and Rightmove does not accept any liability for error or omission. If you have found an error with the data or need further information please contact HM Land Registry.
Permitted Use: Viewers of this Information are granted permission to access this Crown copyright material and to download it onto electronic, magnetic, optical or similar storage media provided that such activities are for private research, study or in-house use only. Any other use of the material requires the formal written permission of Land Registry which can be requested from us, and is subject to an additional licence and associated charge.
Map data ©OpenStreetMap contributors.
Rightmove takes no liability for your use of, or reliance on, Rightmove's Instant Valuation due to the limitations of our tracking tool listed here. Use of this tool is taken entirely at your own risk. All rights reserved.