
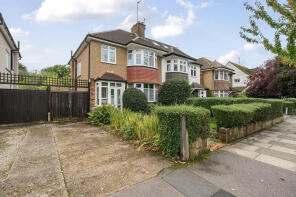
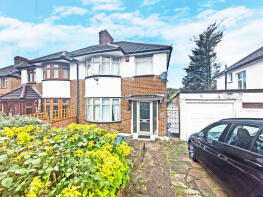
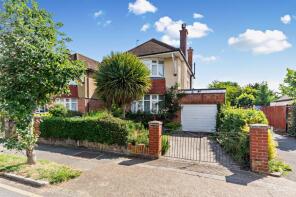
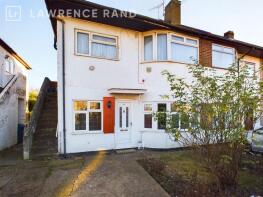
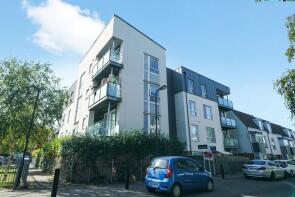
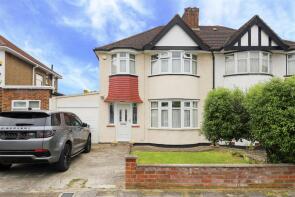
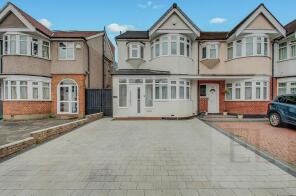
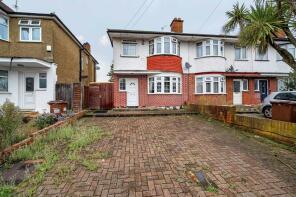
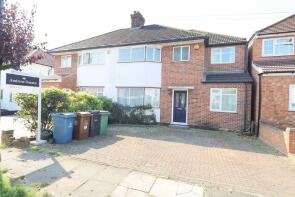
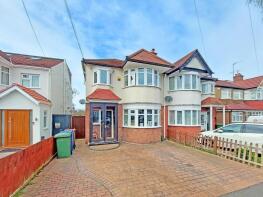
House Prices in Rayners Lane
House prices in Rayners Lane have an overall average of £531,530 over the last year.
The majority of properties sold in Rayners Lane during the last year were terraced properties, selling for an average price of £563,968. Semi-detached properties sold for an average of £610,766, with flats fetching £293,522.
Overall, the historical sold prices in Rayners Lane over the last year were 2% up on the previous year and 7% up on the 2022 peak of £498,592.
Properties Sold
109, Sandringham Crescent, Harrow HA2 9BP
| Today | See what it's worth now |
| 20 Jun 2025 | £610,000 |
| 12 Feb 2007 | £302,000 |
No other historical records.
153, Malvern Avenue, Harrow HA2 9HG
| Today | See what it's worth now |
| 11 Jun 2025 | £700,000 |
| 29 Sep 2010 | £310,000 |
73, Parkfield Crescent, Ruislip HA4 0RD
| Today | See what it's worth now |
| 9 May 2025 | £468,000 |
| 25 Mar 1998 | £90,500 |
No other historical records.
56, Twyford Road, Harrow HA2 0SL
| Today | See what it's worth now |
| 7 May 2025 | £221,995 |
| 7 Sep 2005 | £250,000 |
69, Roxeth Green Avenue, Harrow HA2 8AE
| Today | See what it's worth now |
| 6 May 2025 | £307,000 |
| 26 Feb 2008 | £250,000 |
No other historical records.
95, Exeter Road, South Harrow HA2 9PQ
| Today | See what it's worth now |
| 2 May 2025 | £605,000 |
No other historical records.
65, Warden Avenue, Rayners Lane, Harrow HA2 9LL
| Today | See what it's worth now |
| 25 Apr 2025 | £710,000 |
| 4 Dec 2020 | £467,500 |
No other historical records.
102, Twyford Road, Harrow HA2 0SN
| Today | See what it's worth now |
| 10 Apr 2025 | £280,000 |
| 27 Apr 2001 | £169,000 |
50, Oakington Avenue, Rayners Lane HA2 7JJ
| Today | See what it's worth now |
| 31 Mar 2025 | £635,000 |
No other historical records.
62, Welbeck Road, Harrow HA2 0RR
| Today | See what it's worth now |
| 31 Mar 2025 | £590,000 |
| 25 Nov 2011 | £334,250 |
No other historical records.
17, Park Drive, Harrow HA2 7LT
| Today | See what it's worth now |
| 31 Mar 2025 | £700,000 |
| 19 Jun 1995 | £126,500 |
No other historical records.
81, Stuart Avenue, Harrow HA2 9AS
| Today | See what it's worth now |
| 28 Mar 2025 | £317,500 |
| 28 Sep 2007 | £203,000 |
25, Stuart Avenue, Harrow HA2 9AU
| Today | See what it's worth now |
| 28 Mar 2025 | £610,000 |
| 23 Jan 2004 | £245,000 |
No other historical records.
66, Lucas Avenue, Harrow HA2 9UJ
| Today | See what it's worth now |
| 28 Mar 2025 | £576,000 |
| 22 Sep 2014 | £460,000 |
184, The Ridgeway, North Harrow HA2 7DD

| Today | See what it's worth now |
| 27 Mar 2025 | £650,000 |
No other historical records.
85, Torbay Road, Harrow HA2 9QG
| Today | See what it's worth now |
| 27 Mar 2025 | £650,000 |
| 27 May 2011 | £295,000 |
43, Warden Avenue, Rayners Lane, Harrow HA2 9LL
| Today | See what it's worth now |
| 27 Mar 2025 | £617,000 |
| 2 Apr 2015 | £461,000 |
No other historical records.
16, Emerald Court, Drinkwater Road, Harrow HA2 0FR
| Today | See what it's worth now |
| 27 Mar 2025 | £360,000 |
| 28 Apr 2023 | £324,000 |
19, Sandpiper Drive, Harrow HA2 0SF


| Today | See what it's worth now |
| 26 Mar 2025 | £625,000 |
| 24 Mar 2017 | £520,000 |
No other historical records.
35, Welbeck Road, Harrow HA2 0RP
| Today | See what it's worth now |
| 21 Mar 2025 | £650,000 |
| 25 Aug 2005 | £250,000 |
No other historical records.
217, Torbay Road, Harrow HA2 9QE
| Today | See what it's worth now |
| 20 Mar 2025 | £685,000 |
| 18 Mar 2011 | £265,000 |
72, Roxeth Green Avenue, Harrow HA2 8AG
| Today | See what it's worth now |
| 18 Mar 2025 | £491,500 |
| 13 Sep 2002 | £195,000 |
No other historical records.
16, Drake Road, Harrow HA2 9EA
| Today | See what it's worth now |
| 17 Mar 2025 | £560,000 |
| 21 Dec 2010 | £300,000 |
67, Eastern Avenue, Pinner HA5 1NW
| Today | See what it's worth now |
| 14 Mar 2025 | £719,000 |
| 27 Feb 2001 | £170,000 |
No other historical records.
111, Yeading Avenue, Harrow HA2 9RJ
| Today | See what it's worth now |
| 27 Feb 2025 | £550,000 |
| 11 Aug 2016 | £525,000 |
No other historical records.
Get ready with a Mortgage in Principle
- Personalised result in just 20 minutes
- Find out how much you can borrow
- Get viewings faster with agents
- No impact on your credit score
What's your property worth?
Source Acknowledgement: © Crown copyright. England and Wales house price data is publicly available information produced by the HM Land Registry.This material was last updated on 6 August 2025. It covers the period from 1 January 1995 to 30 June 2025 and contains property transactions which have been registered during that period. Contains HM Land Registry data © Crown copyright and database right 2025. This data is licensed under the Open Government Licence v3.0.
Disclaimer: Rightmove.co.uk provides this HM Land Registry data "as is". The burden for fitness of the data relies completely with the user and is provided for informational purposes only. No warranty, express or implied, is given relating to the accuracy of content of the HM Land Registry data and Rightmove does not accept any liability for error or omission. If you have found an error with the data or need further information please contact HM Land Registry.
Permitted Use: Viewers of this Information are granted permission to access this Crown copyright material and to download it onto electronic, magnetic, optical or similar storage media provided that such activities are for private research, study or in-house use only. Any other use of the material requires the formal written permission of Land Registry which can be requested from us, and is subject to an additional licence and associated charge.
Map data ©OpenStreetMap contributors.
Rightmove takes no liability for your use of, or reliance on, Rightmove's Instant Valuation due to the limitations of our tracking tool listed here. Use of this tool is taken entirely at your own risk. All rights reserved.