
House Prices in Reddingmuirhead
House prices in Reddingmuirhead have an overall average of £278,852 over the last year.
The majority of properties sold in Reddingmuirhead during the last year were detached properties, selling for an average price of £351,163. Semi-detached properties sold for an average of £219,468, with terraced properties fetching £162,805.
Overall, the historical sold prices in Reddingmuirhead over the last year were 8% up on the previous year and 9% up on the 2022 peak of £255,993.
Properties Sold
5, Muir Place, Reddingmuirhead FK2 0WH

| Today | See what it's worth now |
| 27 Jun 2025 | £228,995 |
No other historical records.
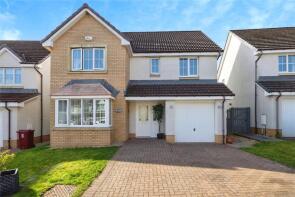
67, Canalside Drive, Falkirk FK2 0FA
| Today | See what it's worth now |
| 26 Jun 2025 | £345,000 |
| 26 Oct 2011 | £233,995 |
No other historical records.
29, Middlerig Avenue, Reddingmuirhead FK2 0WG

| Today | See what it's worth now |
| 24 Jun 2025 | £309,995 |
No other historical records.
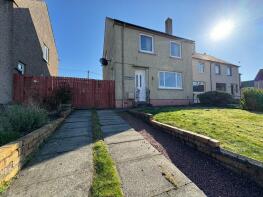
9, Briar Brae, Falkirk FK2 0HR
| Today | See what it's worth now |
| 18 Jun 2025 | £190,744 |
| 29 Oct 2020 | £128,500 |
52, Middlerig Avenue, Reddingmuirhead FK2 0WG

| Today | See what it's worth now |
| 9 Jun 2025 | £266,995 |
No other historical records.
48, Middlerig Avenue, Reddingmuirhead FK2 0WG

| Today | See what it's worth now |
| 9 Jun 2025 | £299,995 |
No other historical records.
8, Middlerig Avenue, Reddingmuirhead FK2 0WG

| Today | See what it's worth now |
| 6 Jun 2025 | £285,995 |
No other historical records.
Glenbogie, Redding Road, Reddingmuirhead FK2 0DP

| Today | See what it's worth now |
| 3 Jun 2025 | £363,000 |
No other historical records.
11, Middlerig Avenue, Reddingmuirhead FK2 0WG

| Today | See what it's worth now |
| 2 Jun 2025 | £192,995 |
No other historical records.
59, Canalside Drive, Falkirk FK2 0FA

| Today | See what it's worth now |
| 2 Jun 2025 | £293,500 |
| 23 Mar 2021 | £225,000 |
31, Middlerig Avenue, Reddingmuirhead FK2 0WG

| Today | See what it's worth now |
| 30 May 2025 | £266,995 |
No other historical records.
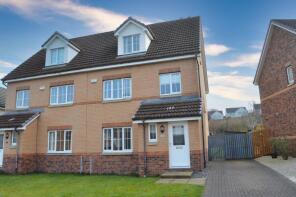
4, Muirhead Place, Reddingmuirhead FK2 0GX
| Today | See what it's worth now |
| 28 May 2025 | £307,000 |
No other historical records.
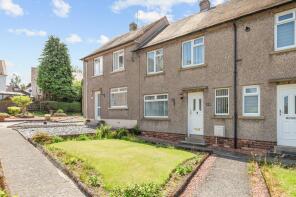
19, Briar Brae, Falkirk FK2 0HR
| Today | See what it's worth now |
| 26 May 2025 | £129,000 |
| 22 Mar 2018 | £104,275 |
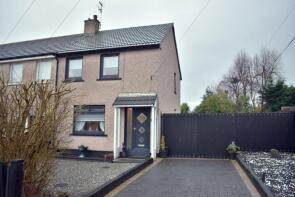
14, Epworth Gardens, Falkirk FK2 0DW
| Today | See what it's worth now |
| 21 May 2025 | £145,000 |
| 12 Apr 2007 | £95,000 |
91, Wallace Brae Drive, Reddingmuirhead FK2 0FB

| Today | See what it's worth now |
| 19 May 2025 | £304,995 |
No other historical records.
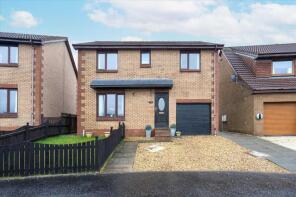
30, Epworth Gardens, Falkirk FK2 0DW
| Today | See what it's worth now |
| 19 May 2025 | £275,000 |
| 30 Aug 2016 | £176,000 |
No other historical records.
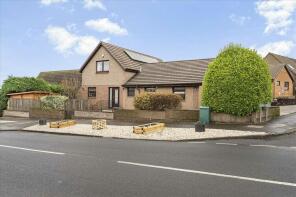
2 Barrden, Fairhaven Terrace, Falkirk FK2 0EG
| Today | See what it's worth now |
| 13 May 2025 | £485,000 |
| 21 Sep 2004 | £190,000 |
No other historical records.
27, Middlerig Avenue, Reddingmuirhead FK2 0WG

| Today | See what it's worth now |
| 9 May 2025 | £309,995 |
No other historical records.
50, Middlerig Avenue, Reddingmuirhead FK2 0WG

| Today | See what it's worth now |
| 7 May 2025 | £259,995 |
No other historical records.
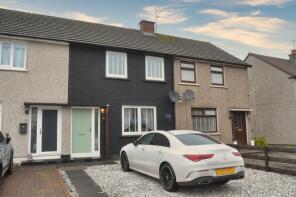
42, Wesley Place, Falkirk FK2 0DS
| Today | See what it's worth now |
| 1 May 2025 | £150,000 |
| 29 Aug 2022 | £130,000 |
46, Middlerig Avenue, Reddingmuirhead FK2 0WG

| Today | See what it's worth now |
| 28 Apr 2025 | £299,995 |
No other historical records.
38, Middlerig Avenue, Reddingmuirhead FK2 0WG

| Today | See what it's worth now |
| 28 Apr 2025 | £291,995 |
No other historical records.
25, Middlerig Avenue, Reddingmuirhead FK2 0WG

| Today | See what it's worth now |
| 28 Apr 2025 | £335,995 |
No other historical records.
17, Corbett Drive, Falkirk FK2 0XW
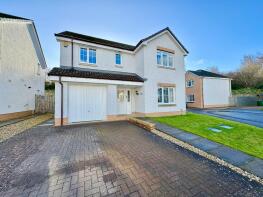
| Today | See what it's worth now |
| 11 Apr 2025 | £327,500 |
| 8 Jun 2021 | £285,000 |
31, Newlands Road, Falkirk FK2 0DE
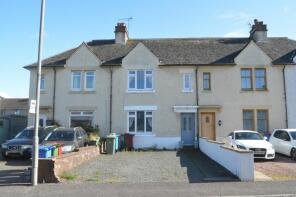
| Today | See what it's worth now |
| 7 Apr 2025 | £150,000 |
| 15 Jul 2024 | £157,500 |
Get ready with a Mortgage in Principle
- Personalised result in just 20 minutes
- Find out how much you can borrow
- Get viewings faster with agents
- No impact on your credit score
What's your property worth?
Source Acknowledgement: © Crown copyright. Scottish house price data is publicly available information produced by the Registers of Scotland. Material has been reproduced with the permission of the Keeper of the Registers of Scotland and contains data compiled by Registers of Scotland. For further information, please contact data@ros.gov.uk. Please note the dates shown here relate to the property's registered date not sold date.This material was last updated on 7 August 2025. It covers the period from 8 December 1987 to 30 June 2025 and contains property transactions which have been registered during that period.
Disclaimer: Rightmove.co.uk provides this Registers of Scotland data "as is". The burden for fitness of the data relies completely with the user and is provided for informational purposes only. No warranty, express or implied, is given relating to the accuracy of content of the Registers of Scotland data and Rightmove plc does not accept any liability for error or omission. If you have found an error with the data or need further information please contact data@ros.gov.uk
Permitted Use: The Registers of Scotland allows the reproduction of the data which it provides to Rightmove.co.uk free of charge in any format or medium only for research, private study or for internal circulation within an organisation. This is subject to it being reproduced accurately and not used in a misleading context. The material must be acknowledged as Crown Copyright. You are not allowed to use this information for commercial purposes, nor must you copy, distribute, sell or publish the data in any way. For any other use of this material, please apply to the Registers of Scotland for a licence. You can do this online at www.ros.gov.uk, by email at data@ros.gov.uk or by writing to Business Development, Registers of Scotland, Meadowbank House, 153 London Road, Edinburgh EH8 7AU.
Map data ©OpenStreetMap contributors.
Rightmove takes no liability for your use of, or reliance on, Rightmove's Instant Valuation due to the limitations of our tracking tool listed here. Use of this tool is taken entirely at your own risk. All rights reserved.
