
House Prices in RG1
House prices in RG1 have an overall average of £320,762 over the last year.
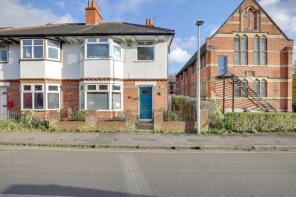
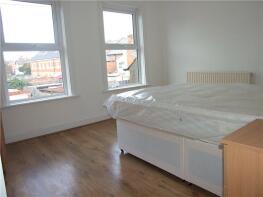
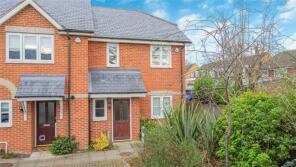
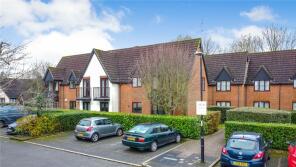
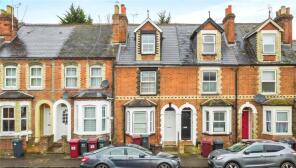
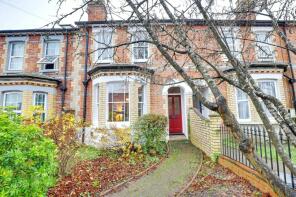
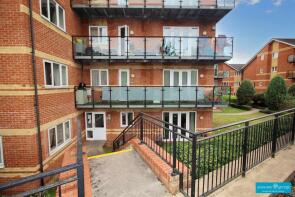
The majority of properties sold in RG1 during the last year were flats, selling for an average price of £242,638. Terraced properties sold for an average of £342,985, with semi-detached properties fetching £468,574.
Overall, the historical sold prices in RG1 over the last year were 4% down on the previous year and 6% down on the 2022 peak of £342,249.
Properties Sold
15, Portway Close, Reading RG1 6LB
| Today | See what it's worth now |
| 25 Jun 2025 | £477,000 |
| 30 Aug 2019 | £397,500 |
No other historical records.
38, Morgan Road, Reading RG1 5HG
| Today | See what it's worth now |
| 23 Jun 2025 | £725,000 |
| 5 Jun 1998 | £125,000 |
No other historical records.
3, Vanbrugh Court, Reading RG1 5NY

| Today | See what it's worth now |
| 20 Jun 2025 | £175,000 |
| 3 Oct 2016 | £185,000 |
3, Riverside House, Fobney Street, Reading RG1 6BH
| Today | See what it's worth now |
| 19 Jun 2025 | £253,000 |
| 11 Apr 2003 | £289,995 |
No other historical records.
155, Wolseley Street, Reading RG1 6AY
| Today | See what it's worth now |
| 18 Jun 2025 | £425,000 |
| 25 May 2018 | £360,000 |
1, Cholmeley Place, Reading RG1 3NH
| Today | See what it's worth now |
| 17 Jun 2025 | £318,000 |
| 2 Jun 2014 | £200,000 |
3, Bucknell Court, Reading RG1 6FB
| Today | See what it's worth now |
| 10 Jun 2025 | £376,000 |
| 28 Jun 2019 | £325,000 |
28, Southern Hill, Reading RG1 5ES
| Today | See what it's worth now |
| 6 Jun 2025 | £196,500 |
| 22 Dec 2009 | £145,000 |
34, Gower Street, Reading RG1 7PE
| Today | See what it's worth now |
| 6 Jun 2025 | £327,000 |
| 22 Jan 2007 | £207,500 |
32, Addington Road, Reading RG1 5PX
| Today | See what it's worth now |
| 6 Jun 2025 | £435,000 |
| 31 Aug 2005 | £239,950 |
No other historical records.
Flat 9, 37, Market Place, Reading RG1 2DE
| Today | See what it's worth now |
| 4 Jun 2025 | £190,000 |
| 28 Oct 2016 | £295,000 |
No other historical records.
Flat 702, 202 Hanover House, Kings Road, Reading RG1 4NN


| Today | See what it's worth now |
| 30 May 2025 | £220,000 |
No other historical records.
41, Capital Point, Temple Place, Reading RG1 6QJ
| Today | See what it's worth now |
| 29 May 2025 | £190,000 |
| 19 Jun 2003 | £174,995 |
No other historical records.
31, Newport Road, Reading RG1 8EA
| Today | See what it's worth now |
| 27 May 2025 | £395,000 |
| 1 Dec 2006 | £216,995 |
Flat 30, 48 Queens Lawns, Alexandra Road, Reading RG1 5PR

| Today | See what it's worth now |
| 27 May 2025 | £205,000 |
| 19 Feb 2019 | £175,000 |
1, Allcroft Road, Reading RG1 5HJ
| Today | See what it's worth now |
| 23 May 2025 | £737,000 |
| 31 Aug 2007 | £372,500 |
Flat 1, 143, London Road, Reading RG1 5DD

| Today | See what it's worth now |
| 19 May 2025 | £197,000 |
| 15 Jul 2016 | £183,000 |
8, Princes Street, Reading RG1 4EG

| Today | See what it's worth now |
| 19 May 2025 | £325,000 |
| 31 Aug 2018 | £313,920 |
Flat 3, 106 Thompsons Yard, Southampton Street, Reading RG1 2QX

| Today | See what it's worth now |
| 16 May 2025 | £170,000 |
| 2 Oct 2014 | £173,000 |
82, Radstock Road, Reading RG1 3PR
| Today | See what it's worth now |
| 16 May 2025 | £250,000 |
| 23 Sep 1996 | £49,960 |
No other historical records.
10, Granby Gardens, Reading RG1 5RT
| Today | See what it's worth now |
| 15 May 2025 | £249,000 |
No other historical records.
83, Hatherley Road, Reading RG1 5QE
| Today | See what it's worth now |
| 14 May 2025 | £341,000 |
| 20 Jan 2021 | £310,000 |
43, Cumberland Road, Reading RG1 3LB
| Today | See what it's worth now |
| 9 May 2025 | £255,000 |
| 15 Nov 2007 | £204,995 |
10, Brownlow Lodge, Brownlow Road, Reading RG1 6NR
| Today | See what it's worth now |
| 9 May 2025 | £265,000 |
| 16 Oct 2017 | £258,000 |
10, York Road, Reading RG1 8DX
| Today | See what it's worth now |
| 8 May 2025 | £280,000 |
| 1 Aug 1997 | £59,500 |
Find out how much your property is worth
The following agents can provide you with a free, no-obligation valuation. Simply select the ones you'd like to hear from.
Sponsored
All featured agents have paid a fee to promote their valuation expertise.

Prospect Estate Agency
Reading

Romans
Reading

Chancellors
Reading

AH Lansley Residential
Reading

Winkworth
Reading
Get ready with a Mortgage in Principle
- Personalised result in just 20 minutes
- Find out how much you can borrow
- Get viewings faster with agents
- No impact on your credit score
What's your property worth?
Source Acknowledgement: © Crown copyright. England and Wales house price data is publicly available information produced by the HM Land Registry.This material was last updated on 6 August 2025. It covers the period from 1 January 1995 to 30 June 2025 and contains property transactions which have been registered during that period. Contains HM Land Registry data © Crown copyright and database right 2025. This data is licensed under the Open Government Licence v3.0.
Disclaimer: Rightmove.co.uk provides this HM Land Registry data "as is". The burden for fitness of the data relies completely with the user and is provided for informational purposes only. No warranty, express or implied, is given relating to the accuracy of content of the HM Land Registry data and Rightmove does not accept any liability for error or omission. If you have found an error with the data or need further information please contact HM Land Registry.
Permitted Use: Viewers of this Information are granted permission to access this Crown copyright material and to download it onto electronic, magnetic, optical or similar storage media provided that such activities are for private research, study or in-house use only. Any other use of the material requires the formal written permission of Land Registry which can be requested from us, and is subject to an additional licence and associated charge.
Data on planning applications, home extensions and build costs is provided by Resi.co.uk. Planning data is calculated using the last 2 years of residential applications within the selected planning authority. Home extension data, such as build costs and project timelines, are calculated using approximately 9,000 architectural projects Resi has completed, and 23,500 builders quotes submitted via Resi's platform. Build costs are adjusted according to inflation rates to more accurately represent today's prices.
Map data ©OpenStreetMap contributors.
Rightmove takes no liability for your use of, or reliance on, Rightmove's Instant Valuation due to the limitations of our tracking tool listed here. Use of this tool is taken entirely at your own risk. All rights reserved.