
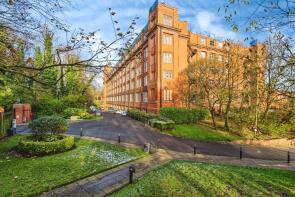
House Prices in Sharples
House prices in Sharples have an overall average of £220,912 over the last year.
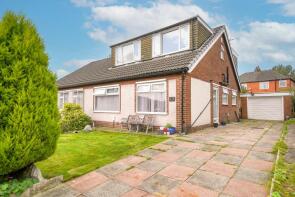
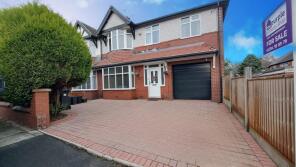
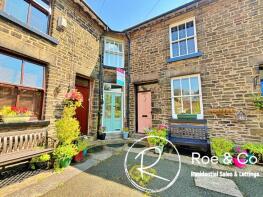
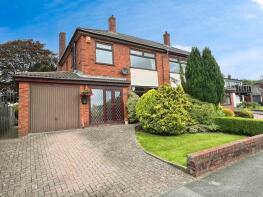
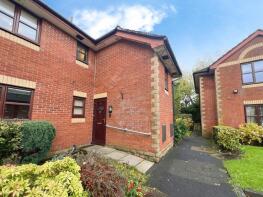
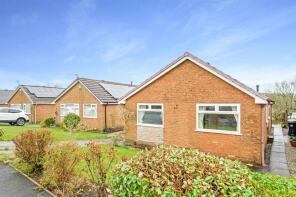
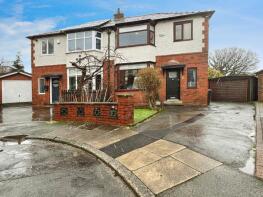
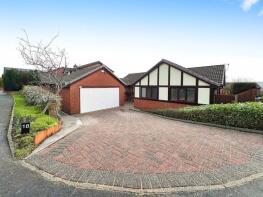
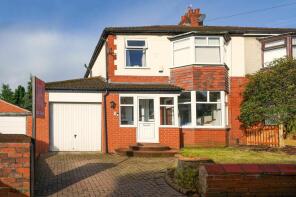
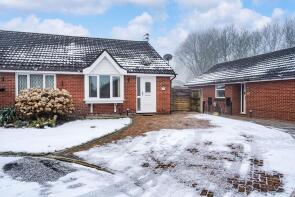
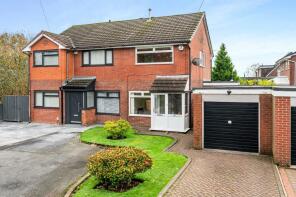
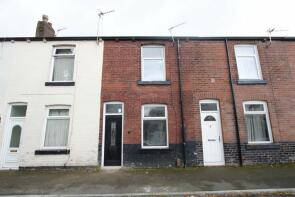
The majority of properties sold in Sharples during the last year were semi-detached properties, selling for an average price of £248,357. Terraced properties sold for an average of £175,548, with detached properties fetching £353,395.
Overall, the historical sold prices in Sharples over the last year were 3% down on the previous year and similar to the 2022 peak of £219,866.
Properties Sold
227, Holden Mill, Blackburn Road, Bolton BL1 7PN

| Today | See what it's worth now |
| 13 Jun 2025 | £105,000 |
| 18 Dec 2009 | £106,000 |
No other historical records.
439, Holden Mill, Blackburn Road, Bolton BL1 7QJ
| Today | See what it's worth now |
| 13 Jun 2025 | £151,000 |
| 5 Oct 2016 | £135,500 |
31, Sharples Hall Mews, Bolton BL1 7HL
| Today | See what it's worth now |
| 3 Jun 2025 | £91,500 |
| 12 Mar 2018 | £70,000 |
15, Neston Avenue, Bolton BL1 8SQ
| Today | See what it's worth now |
| 25 May 2025 | £260,000 |
| 21 Aug 2009 | £131,000 |
No other historical records.
2, Thorncliffe Road, Bolton BL1 7ER
| Today | See what it's worth now |
| 23 May 2025 | £390,000 |
| 16 Jun 1995 | £58,000 |
No other historical records.
62, Ashworth Lane, Bolton BL1 8RD


| Today | See what it's worth now |
| 23 May 2025 | £110,000 |
| 16 Oct 1998 | £38,500 |
No other historical records.
12, Park View, Bolton BL1 7LE
| Today | See what it's worth now |
| 19 May 2025 | £220,000 |
| 26 Nov 2021 | £192,000 |
64, Limefield Road, Bolton BL1 6LA
| Today | See what it's worth now |
| 16 May 2025 | £325,000 |
| 27 Feb 2004 | £182,500 |
No other historical records.
15, Sharples Hall Mews, Bolton BL1 7HL
| Today | See what it's worth now |
| 16 May 2025 | £82,000 |
| 22 Jun 2012 | £57,750 |
2, Mitre Street, Bolton BL1 6QJ
| Today | See what it's worth now |
| 13 May 2025 | £165,000 |
| 28 Apr 2017 | £76,500 |
44, Thornham Drive, Bolton BL1 7RE
| Today | See what it's worth now |
| 9 May 2025 | �£240,000 |
| 12 Nov 2009 | £125,000 |
No other historical records.
1, Thorncliffe Road, Bolton BL1 7ER

| Today | See what it's worth now |
| 9 May 2025 | £297,000 |
No other historical records.
6, Outwood Grove, Bolton BL1 7EW
| Today | See what it's worth now |
| 9 May 2025 | £235,000 |
| 5 May 2022 | £228,000 |
68, Heatherfield, Bolton BL1 7QF
| Today | See what it's worth now |
| 8 May 2025 | £97,000 |
| 9 Feb 2007 | £98,000 |
No other historical records.
5, Rowan Court, Bolton BL1 7SL

| Today | See what it's worth now |
| 2 May 2025 | £82,500 |
| 31 Mar 2017 | £275,000 |
No other historical records.
18, Wincanton Drive, Bolton BL1 7PG
| Today | See what it's worth now |
| 29 Apr 2025 | £350,000 |
| 23 Jul 2013 | £215,000 |
No other historical records.
9, Chelford Avenue, Bolton BL1 7AY
| Today | See what it's worth now |
| 25 Apr 2025 | £243,000 |
| 3 Sep 2007 | £120,000 |
33, Beeston Close, Bolton BL1 7RT
| Today | See what it's worth now |
| 25 Apr 2025 | £175,000 |
| 28 Nov 2022 | £160,000 |
116, Thornham Drive, Bolton BL1 7RF
| Today | See what it's worth now |
| 7 Apr 2025 | £196,000 |
No other historical records.
6, Neston Avenue, Bolton BL1 8SQ

| Today | See what it's worth now |
| 4 Apr 2025 | £250,000 |
No other historical records.
11, Cameron Street, Bolton BL1 6RG
| Today | See what it's worth now |
| 2 Apr 2025 | £98,000 |
| 28 Apr 2004 | £40,000 |
No other historical records.
639, Holden Mill, Blackburn Road, Bolton BL1 7QP
| Today | See what it's worth now |
| 31 Mar 2025 | £150,000 |
| 17 Apr 2015 | £158,000 |
No other historical records.
436, Holden Mill, Blackburn Road, Bolton BL1 7QJ

| Today | See what it's worth now |
| 31 Mar 2025 | £135,500 |
| 19 Sep 2014 | £131,200 |
No other historical records.
60, Dales Brow, Bolton BL1 7RU
| Today | See what it's worth now |
| 31 Mar 2025 | £205,000 |
| 14 May 2007 | £133,000 |
12, Sharples Hall Fold, Bolton BL1 7EH
| Today | See what it's worth now |
| 28 Mar 2025 | £162,950 |
| 6 Mar 2009 | £120,000 |
Get ready with a Mortgage in Principle
- Personalised result in just 20 minutes
- Find out how much you can borrow
- Get viewings faster with agents
- No impact on your credit score
What's your property worth?
Source Acknowledgement: © Crown copyright. England and Wales house price data is publicly available information produced by the HM Land Registry.This material was last updated on 6 August 2025. It covers the period from 1 January 1995 to 30 June 2025 and contains property transactions which have been registered during that period. Contains HM Land Registry data © Crown copyright and database right 2025. This data is licensed under the Open Government Licence v3.0.
Disclaimer: Rightmove.co.uk provides this HM Land Registry data "as is". The burden for fitness of the data relies completely with the user and is provided for informational purposes only. No warranty, express or implied, is given relating to the accuracy of content of the HM Land Registry data and Rightmove does not accept any liability for error or omission. If you have found an error with the data or need further information please contact HM Land Registry.
Permitted Use: Viewers of this Information are granted permission to access this Crown copyright material and to download it onto electronic, magnetic, optical or similar storage media provided that such activities are for private research, study or in-house use only. Any other use of the material requires the formal written permission of Land Registry which can be requested from us, and is subject to an additional licence and associated charge.
Map data ©OpenStreetMap contributors.
Rightmove takes no liability for your use of, or reliance on, Rightmove's Instant Valuation due to the limitations of our tracking tool listed here. Use of this tool is taken entirely at your own risk. All rights reserved.