
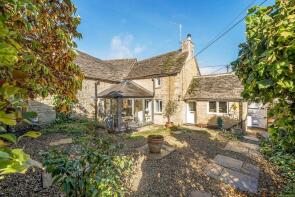
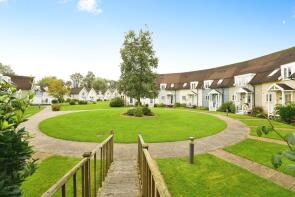
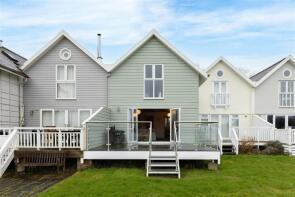
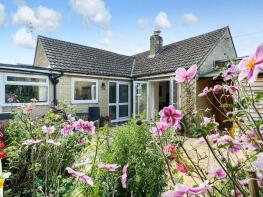
House Prices in South Cerney
House prices in South Cerney have an overall average of £482,607 over the last year.
The majority of properties sold in South Cerney during the last year were semi-detached properties, selling for an average price of £409,650. Detached properties sold for an average of £749,322, with terraced properties fetching £283,476.
Overall, the historical sold prices in South Cerney over the last year were 13% down on the previous year and 10% down on the 2022 peak of £537,639.
Properties Sold
30, Isis Lakes, Spine Road East, Cirencester GL7 5LT
| Today | See what it's worth now |
| 6 Jun 2025 | £275,000 |
| 22 Oct 2020 | £245,000 |
38, Windrush Lake, Spine Road East, Cirencester GL7 5TJ
| Today | See what it's worth now |
| 23 May 2025 | £336,000 |
| 31 Mar 2004 | £192,000 |
Little Barclay, School Lane, Cirencester GL7 5TZ
| Today | See what it's worth now |
| 23 May 2025 | £700,000 |
| 7 Jun 2019 | £560,000 |
9, Teal Way, Cirencester GL7 5WL
| Today | See what it's worth now |
| 21 May 2025 | £750,000 |
| 5 Sep 2018 | £550,000 |
17, Station Road, Cirencester GL7 5UE
| Today | See what it's worth now |
| 9 May 2025 | £345,000 |
| 5 Aug 2022 | £330,000 |
14, Beverstone Road, Cirencester GL7 5XU
| Today | See what it's worth now |
| 30 Apr 2025 | £110,291 |
| 30 Sep 2022 | £236,000 |
5, The Leaze, Cirencester GL7 5UL
| Today | See what it's worth now |
| 28 Mar 2025 | £385,000 |
| 28 Nov 2012 | £225,500 |
5, Jubilee Gardens, Cirencester GL7 5XW
| Today | See what it's worth now |
| 28 Mar 2025 | £299,950 |
| 20 Jun 2018 | £230,000 |
Corner Cottage, High Street, Cirencester GL7 5UP
| Today | See what it's worth now |
| 27 Mar 2025 | £377,500 |
| 1 Apr 2014 | £235,000 |
3, Chiffchaff Close, Cirencester GL7 5WD


| Today | See what it's worth now |
| 27 Mar 2025 | £786,000 |
| 28 Feb 2018 | £549,450 |
11, Isis Lakes, Spine Road East, Cirencester GL7 5LT
| Today | See what it's worth now |
| 25 Mar 2025 | £235,000 |
| 2 Jan 1997 | £24,595 |
No other historical records.
30, Spring Lakes, Station Road, South Cerney GL7 5TH
| Today | See what it's worth now |
| 14 Mar 2025 | £268,000 |
No other historical records.
6, Broadway Lane, Cirencester GL7 5UH

| Today | See what it's worth now |
| 26 Feb 2025 | £510,250 |
| 6 Sep 1999 | £178,000 |
No other historical records.
Southways, Station Road, Cirencester GL7 5UE
| Today | See what it's worth now |
| 25 Feb 2025 | £440,000 |
| 8 Jul 2002 | £179,950 |
62, Oak Way, Cirencester GL7 5XX
| Today | See what it's worth now |
| 14 Feb 2025 | £180,000 |
| 2 Mar 2021 | £187,500 |
63, Boxbush Road, Cirencester GL7 5XJ
| Today | See what it's worth now |
| 10 Feb 2025 | �£124,500 |
| 20 May 2016 | £105,000 |
86, Windrush Lake, Spine Road East, Cirencester GL7 5TJ
| Today | See what it's worth now |
| 10 Feb 2025 | £420,000 |
| 24 May 2019 | £285,500 |
31, Robert Franklin Way, South Cerney GL7 5UD
| Today | See what it's worth now |
| 31 Jan 2025 | £490,000 |
No other historical records.
34, Nightingale Way, Cirencester GL7 5WB
| Today | See what it's worth now |
| 17 Jan 2025 | £390,000 |
| 18 Nov 2016 | £335,995 |
No other historical records.
49, The Lennards, South Cerney GL7 5UX
| Today | See what it's worth now |
| 17 Jan 2025 | £255,000 |
No other historical records.
Meadow Cottage, Road From North West Of Albertine To High Street, Upper Up, Cirencester GL7 5US
| Today | See what it's worth now |
| 18 Dec 2024 | £687,500 |
| 7 Aug 2015 | £430,000 |
70, Windrush Lake, Spine Road East, Cirencester GL7 5TJ

| Today | See what it's worth now |
| 6 Dec 2024 | £380,000 |
| 11 Dec 2015 | £280,000 |
No other historical records.
2, Swan Close, Cirencester GL7 5WP
| Today | See what it's worth now |
| 5 Dec 2024 | £1,250,000 |
| 13 Aug 2013 | £770,000 |
No other historical records.
32, Jubilee Gardens, Cirencester GL7 5XW
| Today | See what it's worth now |
| 29 Nov 2024 | £287,500 |
| 19 Dec 2014 | £205,000 |
4, Beverstone Road, Cirencester GL7 5XU
| Today | See what it's worth now |
| 29 Nov 2024 | £228,000 |
| 19 Aug 2016 | £163,000 |
Get ready with a Mortgage in Principle
- Personalised result in just 20 minutes
- Find out how much you can borrow
- Get viewings faster with agents
- No impact on your credit score
What's your property worth?
Source Acknowledgement: © Crown copyright. England and Wales house price data is publicly available information produced by the HM Land Registry.This material was last updated on 6 August 2025. It covers the period from 1 January 1995 to 30 June 2025 and contains property transactions which have been registered during that period. Contains HM Land Registry data © Crown copyright and database right 2025. This data is licensed under the Open Government Licence v3.0.
Disclaimer: Rightmove.co.uk provides this HM Land Registry data "as is". The burden for fitness of the data relies completely with the user and is provided for informational purposes only. No warranty, express or implied, is given relating to the accuracy of content of the HM Land Registry data and Rightmove does not accept any liability for error or omission. If you have found an error with the data or need further information please contact HM Land Registry.
Permitted Use: Viewers of this Information are granted permission to access this Crown copyright material and to download it onto electronic, magnetic, optical or similar storage media provided that such activities are for private research, study or in-house use only. Any other use of the material requires the formal written permission of Land Registry which can be requested from us, and is subject to an additional licence and associated charge.
Map data ©OpenStreetMap contributors.
Rightmove takes no liability for your use of, or reliance on, Rightmove's Instant Valuation due to the limitations of our tracking tool listed here. Use of this tool is taken entirely at your own risk. All rights reserved.