
House Prices in South Lynn
House prices in South Lynn have an overall average of £279,455 over the last year.
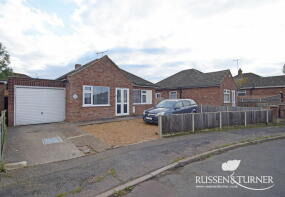
The majority of properties sold in South Lynn during the last year were detached properties, selling for an average price of £327,313. Semi-detached properties sold for an average of £224,208, with terraced properties fetching £124,302.
Overall, the historical sold prices in South Lynn over the last year were similar to the previous year and 4% down on the 2022 peak of £291,715.
Properties Sold
47, Low Road, King's Lynn PE34 3PE
| Today | See what it's worth now |
| 6 Jun 2025 | £270,000 |
| 11 Jun 2020 | £240,000 |
23, Napthans Lane, King's Lynn PE34 3QU
| Today | See what it's worth now |
| 2 Jun 2025 | £350,000 |
| 31 Oct 2008 | £229,490 |
No other historical records.
21 Willow Cottage, Mill Road, King's Lynn PE34 3HL
| Today | See what it's worth now |
| 30 May 2025 | £375,000 |
| 30 Sep 2020 | £250,000 |
64 River Cottage, Low Road, King's Lynn PE34 3PE
| Today | See what it's worth now |
| 13 May 2025 | £300,000 |
| 11 Jun 2001 | £42,500 |
No other historical records.
26, St Peters Road, King's Lynn PE34 3HB


| Today | See what it's worth now |
| 8 May 2025 | £550,000 |
No other historical records.
5, Bentinck Way, West Lynn, King's Lynn PE34 3LZ
| Today | See what it's worth now |
| 1 May 2025 | £242,500 |
| 8 Nov 2022 | £227,500 |
No other historical records.
100a, Wisbech Road, King's Lynn PE30 5LJ
| Today | See what it's worth now |
| 15 Apr 2025 | £120,000 |
| 2 Dec 2022 | £122,000 |
98a, Wisbech Road, King's Lynn PE30 5LJ
| Today | See what it's worth now |
| 14 Apr 2025 | £120,000 |
No other historical records.
12, Church Road, King's Lynn PE34 3QG
| Today | See what it's worth now |
| 11 Apr 2025 | £310,000 |
| 14 Dec 2022 | £350,000 |
12, St Peters Road, King's Lynn PE34 3HB
| Today | See what it's worth now |
| 31 Mar 2025 | £260,000 |
| 10 Feb 2021 | £165,000 |
No other historical records.
8, St Peters Road, West Lynn, King's Lynn PE34 3LG
| Today | See what it's worth now |
| 27 Mar 2025 | £200,000 |
| 27 May 2011 | £127,500 |
76, West Way, King's Lynn PE34 3QB
| Today | See what it's worth now |
| 26 Mar 2025 | £355,000 |
| 8 Feb 2013 | £150,000 |
No other historical records.
17, Orchard Road, King's Lynn PE34 3DS
| Today | See what it's worth now |
| 25 Mar 2025 | £249,000 |
| 6 Nov 2013 | £127,000 |
2, Garden Road, King's Lynn PE34 3DT
| Today | See what it's worth now |
| 21 Mar 2025 | £220,000 |
| 25 May 2006 | £167,000 |
No other historical records.
2, Cherry Tree Drive, West Lynn, King's Lynn PE34 3LA
| Today | See what it's worth now |
| 21 Mar 2025 | £253,000 |
| 18 Dec 2015 | £180,000 |
26 Lowroofs, Church Road, King's Lynn PE34 3DG
| Today | See what it's worth now |
| 10 Mar 2025 | £150,000 |
| 16 Aug 2017 | £87,500 |
No other historical records.
89a, Stow Road, Wiggenhall St Mary Magdalen PE34 3DJ

| Today | See what it's worth now |
| 7 Mar 2025 | £130,000 |
No other historical records.
5, Turrell Close, King's Lynn PE34 3FJ

| Today | See what it's worth now |
| 5 Mar 2025 | £362,500 |
| 8 Aug 2014 | £198,500 |
4, Vinery Close, West Lynn, King's Lynn PE34 3NA
| Today | See what it's worth now |
| 28 Feb 2025 | £231,000 |
No other historical records.
Meadow End, Cuckoo Road, Stow Bridge PE34 3NY
| Today | See what it's worth now |
| 17 Jan 2025 | £168,000 |
No other historical records.
28, Hillen Road, King's Lynn PE30 5LG

| Today | See what it's worth now |
| 14 Jan 2025 | £178,000 |
No other historical records.
22, Meadow Way, West Lynn, King's Lynn PE34 3JZ
| Today | See what it's worth now |
| 18 Dec 2024 | £251,000 |
| 25 May 2018 | £212,500 |
5 Low Lodge, Low Road, King's Lynn PE34 3PE
| Today | See what it's worth now |
| 18 Dec 2024 | £404,460 |
| 30 Aug 2022 | £325,000 |
7, Cedar Way, West Lynn, King's Lynn PE34 3JY

| Today | See what it's worth now |
| 6 Dec 2024 | £235,000 |
No other historical records.
109 Trelawny, St Peters Road, West Lynn, King's Lynn PE34 3JR
| Today | See what it's worth now |
| 26 Nov 2024 | £215,000 |
| 12 Dec 2013 | £156,000 |
Get ready with a Mortgage in Principle
- Personalised result in just 20 minutes
- Find out how much you can borrow
- Get viewings faster with agents
- No impact on your credit score
What's your property worth?
Source Acknowledgement: © Crown copyright. England and Wales house price data is publicly available information produced by the HM Land Registry.This material was last updated on 6 August 2025. It covers the period from 1 January 1995 to 30 June 2025 and contains property transactions which have been registered during that period. Contains HM Land Registry data © Crown copyright and database right 2025. This data is licensed under the Open Government Licence v3.0.
Disclaimer: Rightmove.co.uk provides this HM Land Registry data "as is". The burden for fitness of the data relies completely with the user and is provided for informational purposes only. No warranty, express or implied, is given relating to the accuracy of content of the HM Land Registry data and Rightmove does not accept any liability for error or omission. If you have found an error with the data or need further information please contact HM Land Registry.
Permitted Use: Viewers of this Information are granted permission to access this Crown copyright material and to download it onto electronic, magnetic, optical or similar storage media provided that such activities are for private research, study or in-house use only. Any other use of the material requires the formal written permission of Land Registry which can be requested from us, and is subject to an additional licence and associated charge.
Map data ©OpenStreetMap contributors.
Rightmove takes no liability for your use of, or reliance on, Rightmove's Instant Valuation due to the limitations of our tracking tool listed here. Use of this tool is taken entirely at your own risk. All rights reserved.